Home /
Expert Answers /
Economics /
the-following-table-shows-the-average-nominal-interest-rates-on-six-month-treasury-bills-between-1-pa657
(Solved): The following table shows the average nominal interest rates on six-month Treasury bills between 1 ...
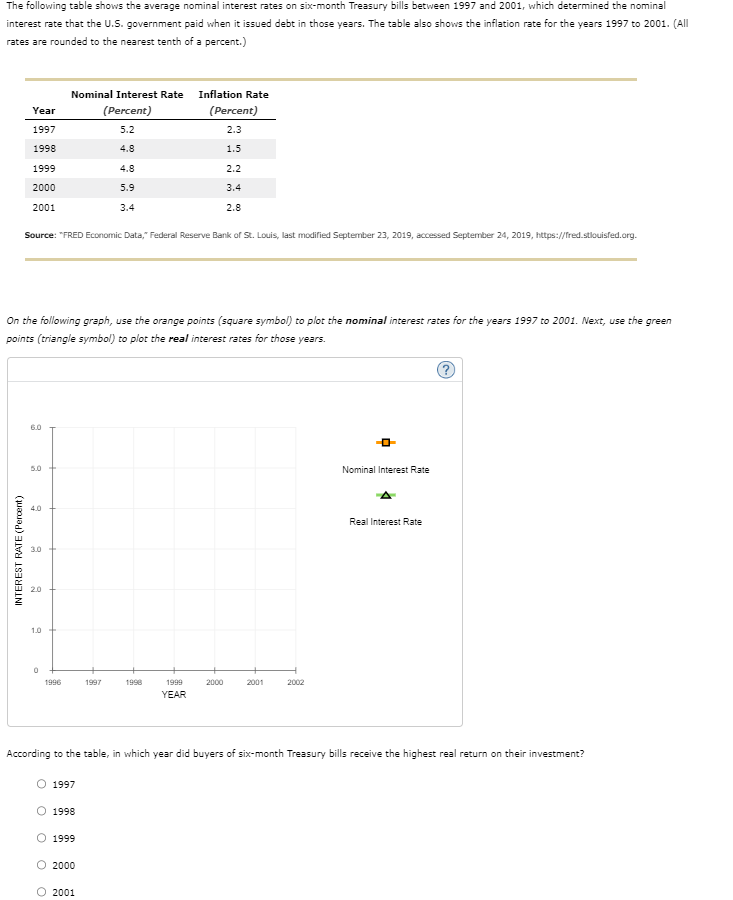
The following table shows the average nominal interest rates on six-month Treasury bills between 1997 and 2001 , which determined the nominal interest rate that the U.S. government paid when it issued debt in those years. The table also shows the inflation rate for the years 1997 to 2001 . (All rates are rounded to the nearest tenth of a percent.) Source: "FRED Economic Data," Federal Reserve Bank of St. Louis, last modified September 23, 2019, accessed September 24, 2019, https://fred.stlouisfed.org. On the following graph, use the orange points (square symbol) to plot the nominal interest rates for the years 1997 to 2001 . Next, use the green points (triangle symbol) to plot the real interest rates for those years. According to the table, in which year did buyers of six-month Treasury bills receive the highest real return on their investment? 1997 1998 1999 2000 2001
Expert Answer
Nominal economic variables or the nominal GDP show the value of economic conditions based on current market price level. The values of GDP is counted
