Home /
Expert Answers /
Other Math /
the-following-table-shows-fuel-consumption-in-billions-of-gallons-of-all-vehicles-in-the-u-s-for-y-pa557
(Solved): The following table shows fuel consumption in billions of gallons of all vehicles in the U.S. for y ...
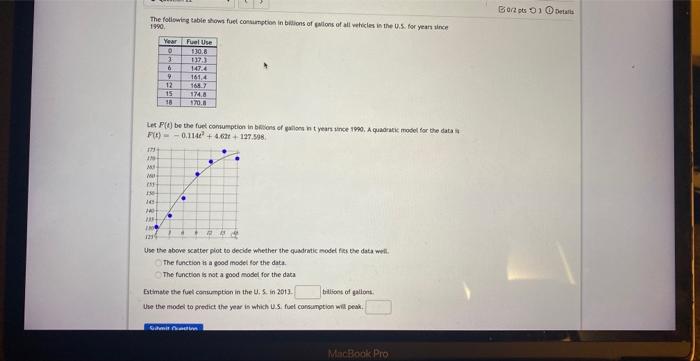
The following table shows fuel consumption in billions of gallons of all vehicles in the U.S. for years since 1990. 1714 IN MA 260 (5 156 16 140 + Year 0 3 6 1109 9 12 15 18 Let F(t) be the fuel consumption in billions of gallons in t years since 1990. A quadratic model for the data i F(t)-0.114 + 4.62 +127.598 Fuel Use 130.8 137.3 ". 147.4 161,4 168.7 174.8 170.0 449 Use the above scatter plot to decide whether the quadratic model fits the data well. The function is a good model for the data. The function is not a good model for the data billions of gallons Estimate the fuel consumption in the U. 5. in 2013. Use the model to predict the year in which U.S. fuel consumption will peak. Gamil Talli) MacBook Pro B0/2 pts 1 Details