Home /
Expert Answers /
Economics /
the-following-table-shows-a-company-39-s-total-cost-of-production-at-various-production-quantities-f-pa766
(Solved): The following table shows a company's total cost of production at various production quantities. F ...
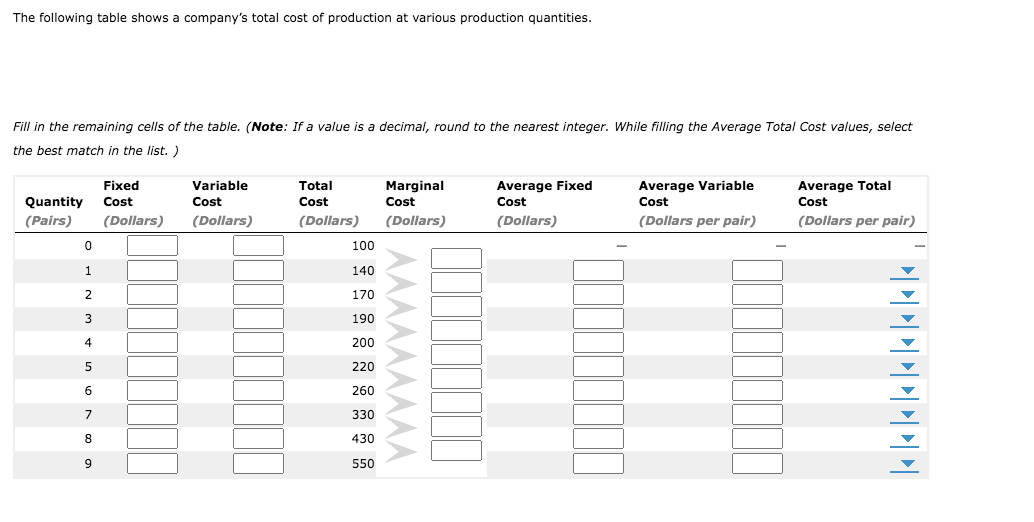
The following table shows a company's total cost of production at various production quantities. Fill in the remaining cells of the table. (Note: If a value is a decimal, round to the nearest integer. While filling the Average Total cost values, the best match in the list.)
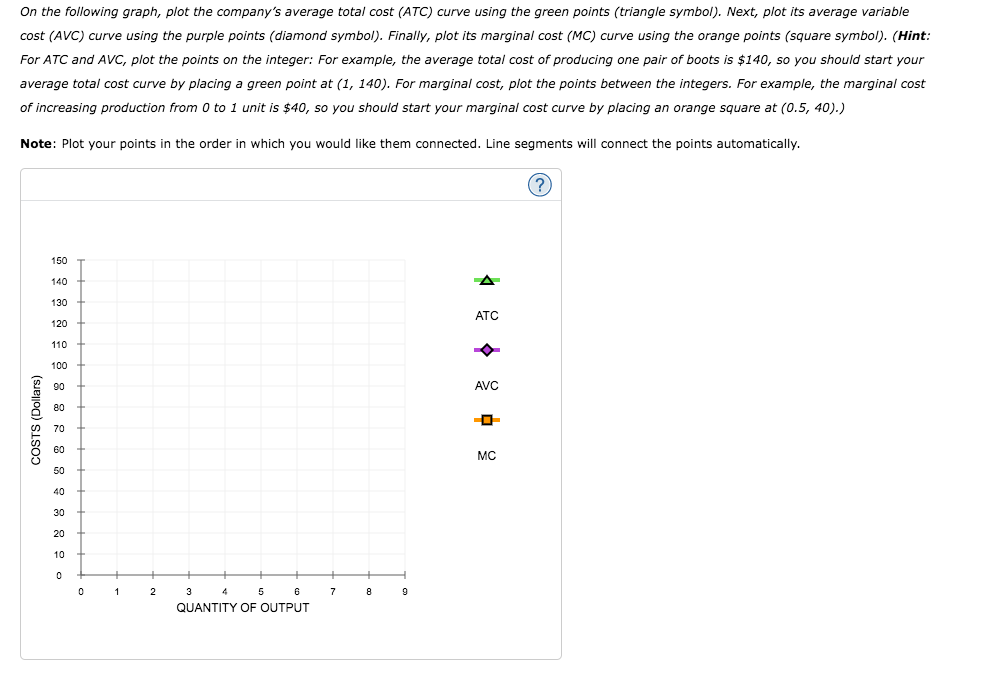
On the following graph, plot the company's average total cost (ATC) curve using the green points (triangle symbol). Next, plot its average variable cost (AVC) curve using the purple points (diamond symbol). Finally, plot its marginal cost (MC) curve using the orange points (square symbol). (Hint: For ATC and AVC, plot the points on the integer: For example, the average total cost of producing one pair of boots is \( \$ 140 \), sour average total cost curve by placing a green point at \( (1,140) \). For marginal cost, plot the points between the integers. For example, the marginal cost of increasing production from 0 to 1 unit is \( \$ 40 \), so you should start your marginal cost curve by placing an orange square at (0.5, 40 ).) Note: Plot your points in the order in which you would like them connected. Line segments will connect the points automatically.
Expert Answer
Total Cost (TC) The cost incurred to produc