Home /
Expert Answers /
Economics /
the-following-table-lists-federal-outlays-revenues-and-gdp-for-the-u-s-economy-during-several-ye-pa802
(Solved): The following table lists federal outlays, revenues, and GDP for the U.S. economy during several ye ...


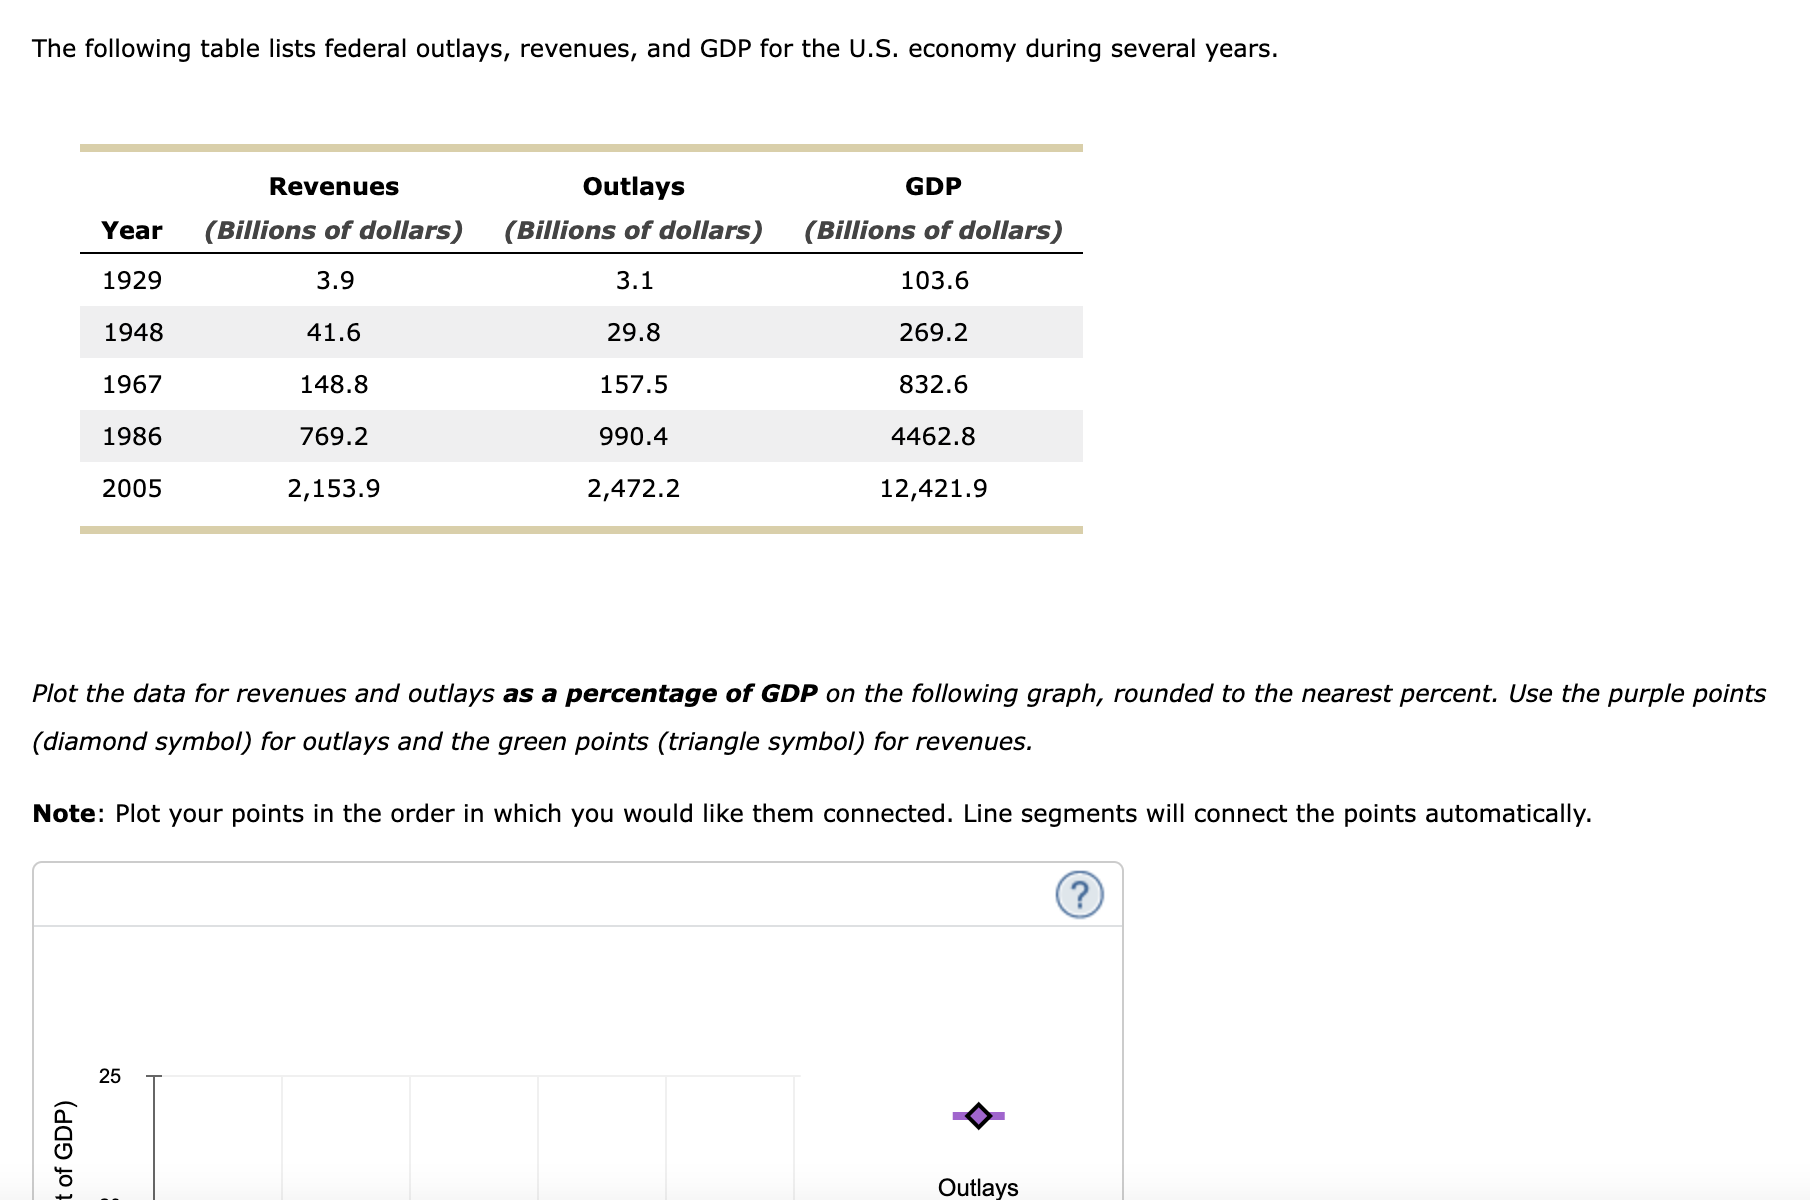
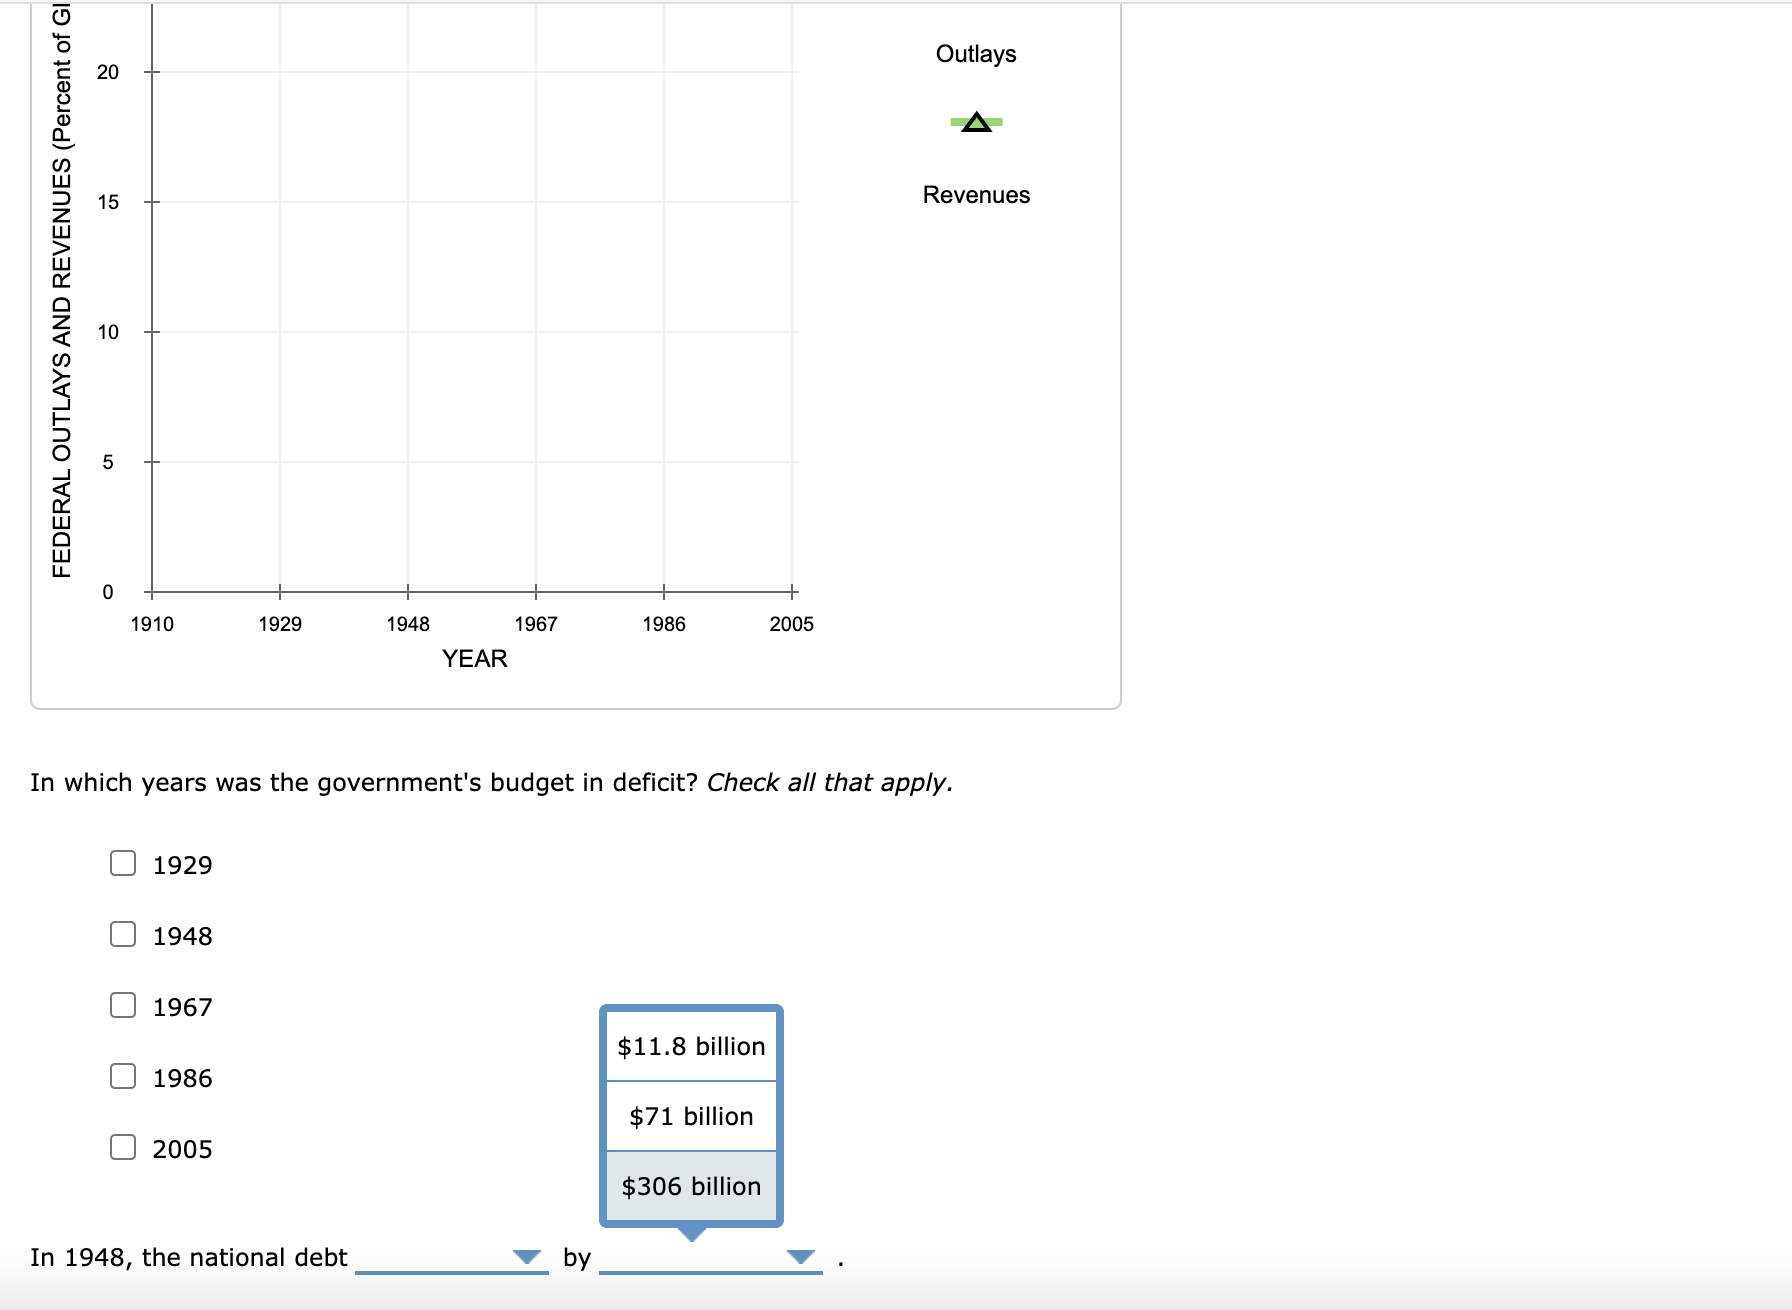
The following table lists federal outlays, revenues, and GDP for the U.S. economy during several years. Plot the data for revenues and outlays as a percentage of GDP on the following graph, rounded to the nearest percent. Use the purple points (diamond symbol) for outlays and the green points (triangle symbol) for revenues. Note: Plot your points in the order in which you would like them connected. Line segments will connect the points automatically.
In which years was the government's budget in deficit? Check all that apply. In 1948 , the national debt by