Home /
Expert Answers /
Economics /
the-following-graph-shows-the-weekly-market-for-handbags-in-some-hypothetical-economy-suppose-the-pa490
(Solved): The following graph shows the weekly market for handbags in some hypothetical economy. Suppose the ...
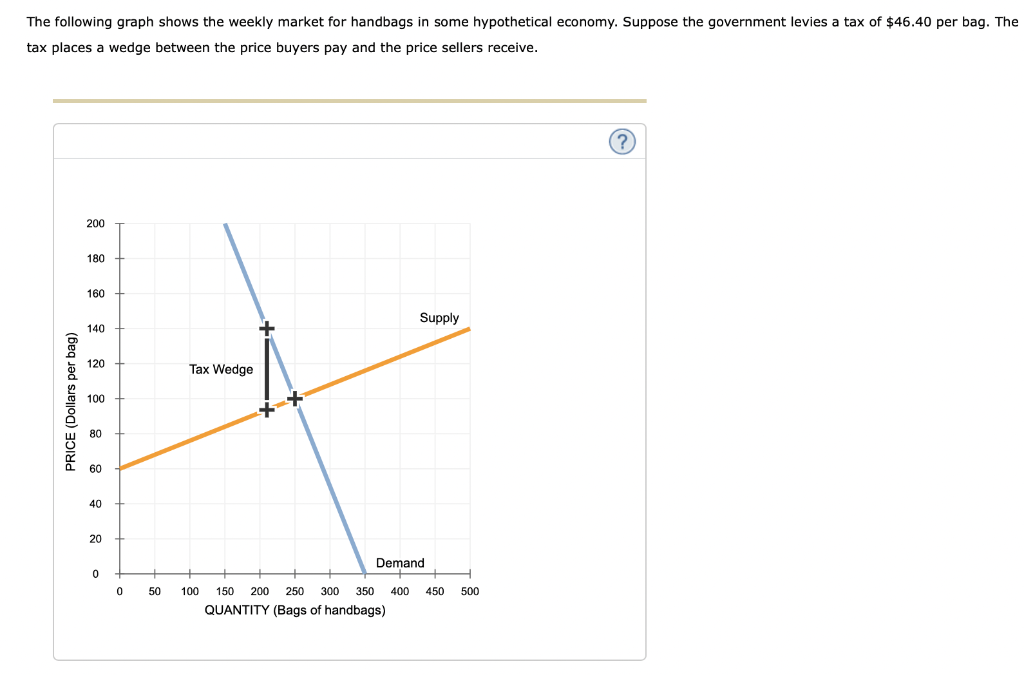
The following graph shows the weekly market for handbags in some hypothetical economy. Suppose the government levies a tax of per bag. The tax places a wedge between the price buyers pay and the price sellers receive.
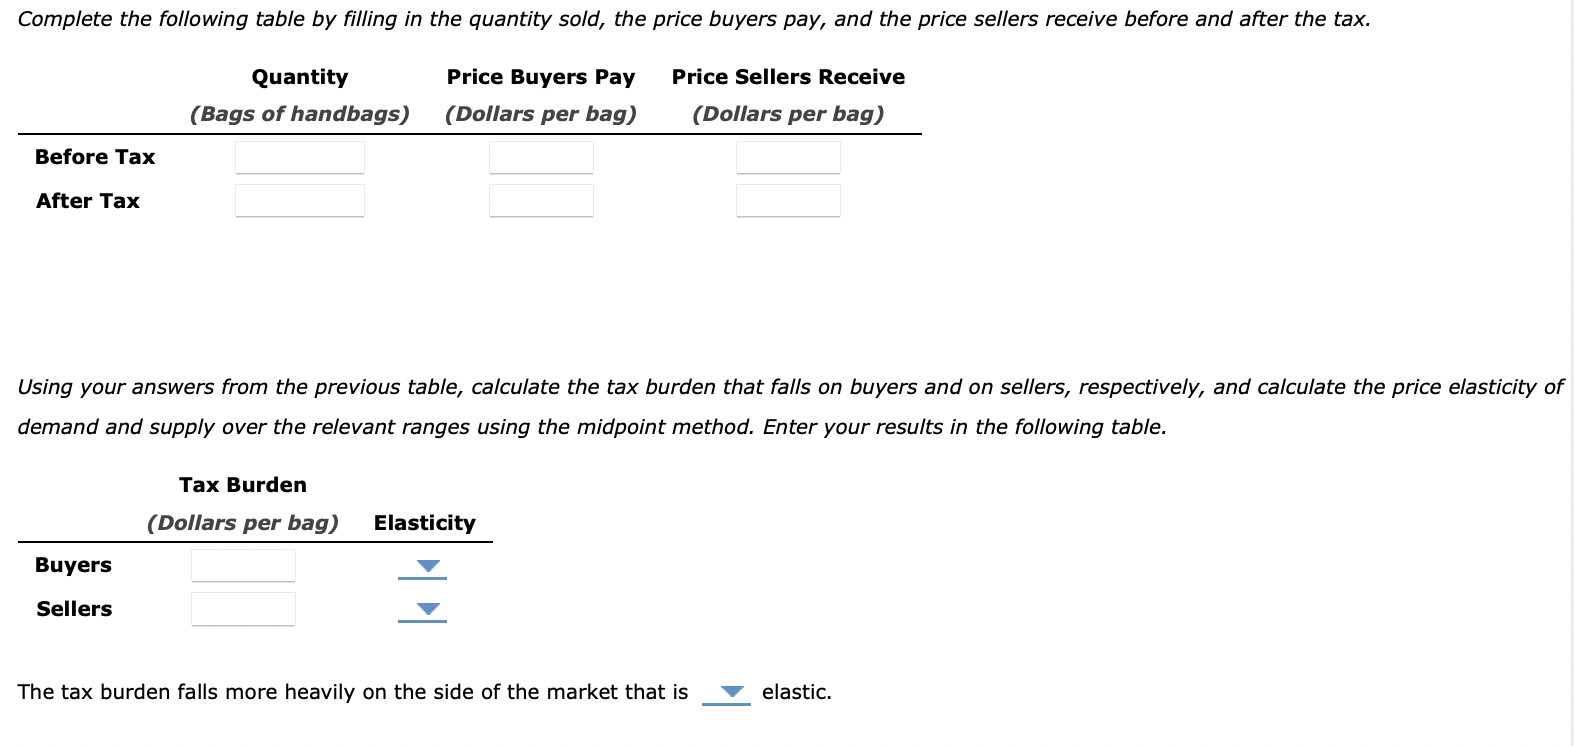
Using your answers from the previous table, calculate the tax burden that falls on buyers and on sellers, respectively, and calculate the price elasticity of demand and supply over the relevant ranges using the midpoint method. Enter your results in the following table. The tax burden falls more heavily on the side of the market that is elastic.
Expert Answer
Equilibrium price before and after tax for handbags