Home /
Expert Answers /
Accounting /
the-following-graph-shows-the-short-run-average-total-cost-curves-and-the-long-run-average-cost-cur-pa992
(Solved): The following graph shows the short-run average total cost curves and the long-run average cost cur ...
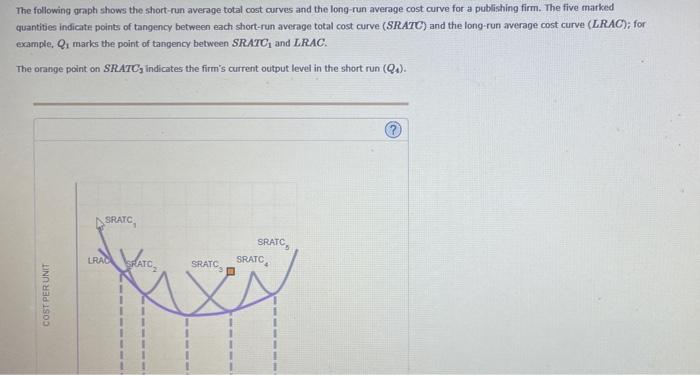
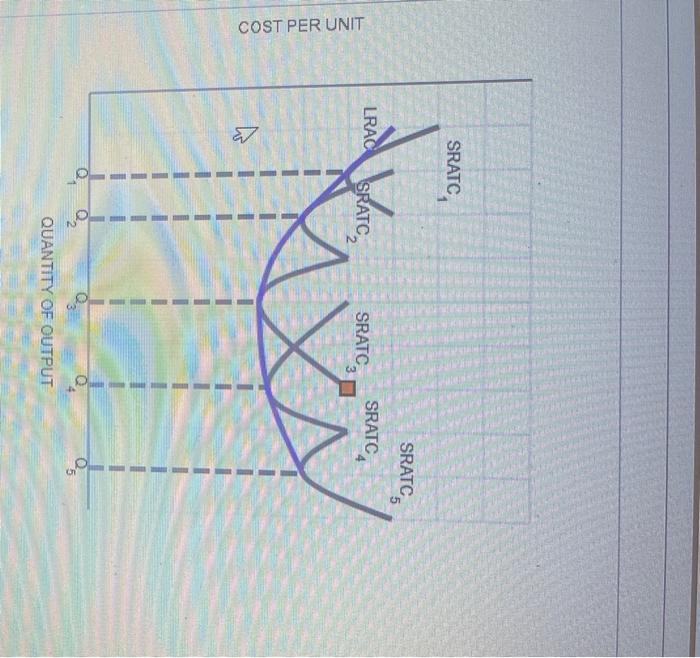
The following graph shows the short-run average total cost curves and the long-run average cost curve for a publishing firm. The five marked quantities indicate points of tangency between each short-run average total cost curve \( (S R A T C) \) and the long-run average cost curve \( (L R A C) \); for example, \( Q_{1} \) marks the point of tangency between \( S R A T C_{1} \) and \( L R A C \). The orange point on \( S P A T C_{3} \) indicates the firm's current output level in the short run \( \left(Q_{4}\right) \).
COSTPER UNIT
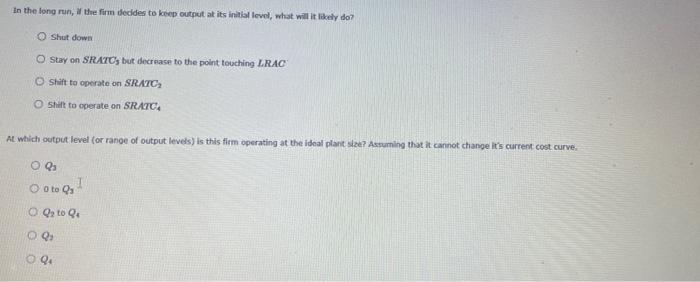
In the fong run, if the firm decides to keep output at its initial level, what will it likely dor Shut down Stay on SPLATC's but decroase to the polnt touching LRAC: Stift to operato on SRATC Shilt to operate on SRATC. At which output level (or ranoe of output levels) is this firm operating at the ideal plant siae? Astuming that it cannot change it's current cost curve. Q3 0 to \( Q_{3} \) \( Q_{2} \operatorname{to} Q_{4} \) Q2 \( Q_{4} \)
Expert Answer
This is the question of production and cost where a graph is given for the short-run average total cost (SRATC) and the long-run average cost (LRAC).