Home /
Expert Answers /
Economics /
the-following-graph-shows-the-same-ppf-for-glacier-as-before-as-well-as-its-invial-consumption-pa772
(Solved): The following graph shows the same PPF for Glacier as before, as well as its invial consumption ...
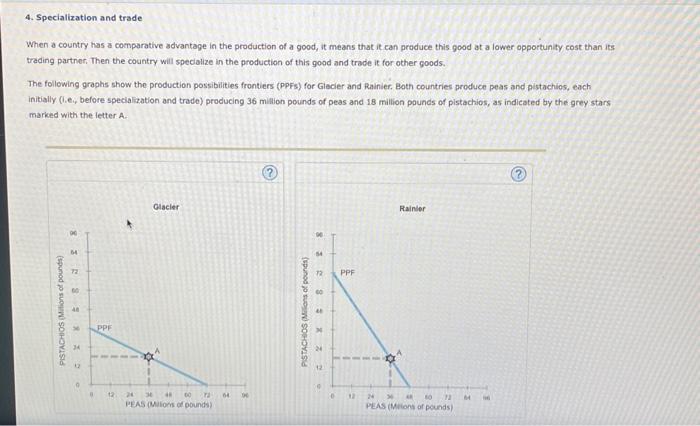
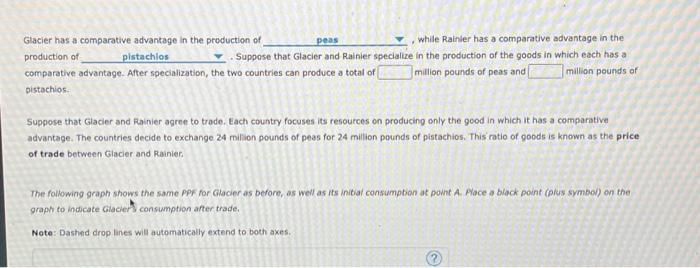
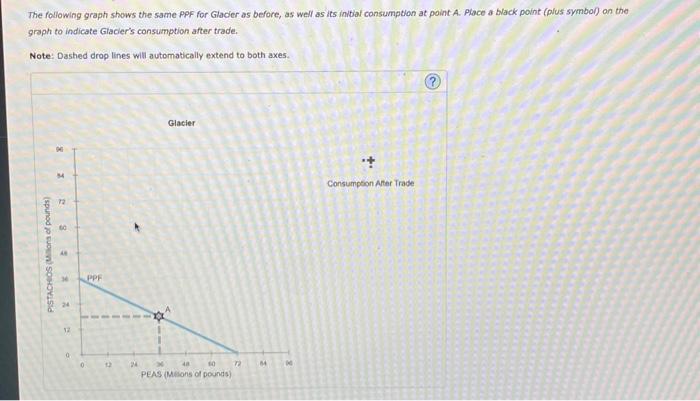
The following graph shows the same PPF for Glacier as before, as well as its invial consumption at point A. Place a black point ( lus symbol) on the graph to indicate Glacier's consumption after trade. Note: Dashed drop lines will automatically extend to both axes.
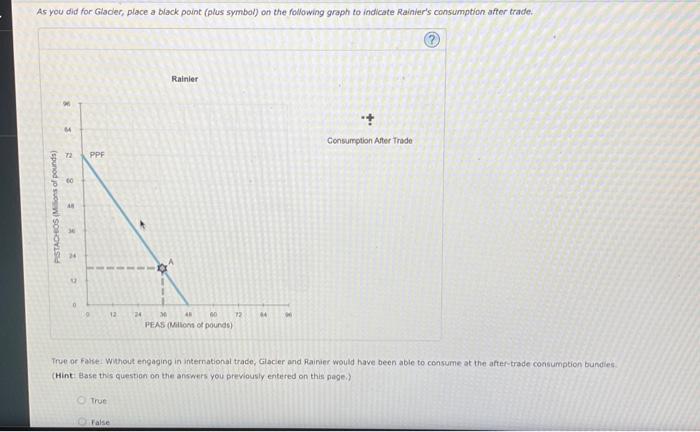
Glacier has a comparative advantage in the production of , while Rainler has a comparative advantage in the production of - Suppose that Glacier and Rainier specialize in the production of the goods in which each has a comparative advantage. After specialization, the two countries can produce a total of million pounds of peas and million pounds of pistachios. Suppose that Glacier and Fainier agree to trade. Each country focuses its resources on producing only the good in which it has a comparitive advantage. The countries decide to exchange 24 milion pounds of peas for 24 million pounds of pistachios. This ratio of goods is known as the price of trade between Glacier and Rainier: The following graph shows the same ppf for Glacier as before, as well as its initial consumpbian at pownt A. Mace a black point (plus symbol) on the graph to indicate Giacier's consumption after trade. Note: Dashed drop lines will automatically extend to both axes.