Home /
Expert Answers /
Economics /
the-following-graph-shows-the-money-market-in-a-hypothetical-economy-the-central-bank-in-this-eco-pa625
(Solved): The following graph shows the money market in a hypothetical economy. The central bank in this eco ...
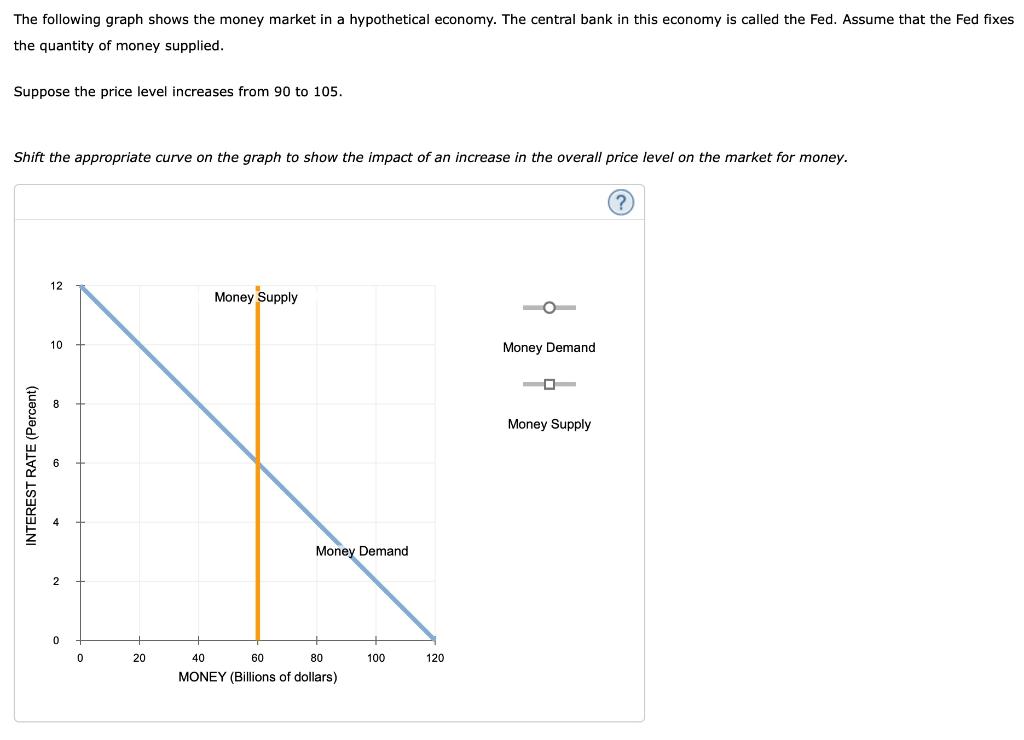

The following graph shows the money market in a hypothetical economy. The central bank in this economy is called the Fed. Assume that the Fed fixes the quantity of money supplied. Suppose the price level increases from 90 to 105. Shift the appropriate curve on the graph to show the impact of an increase in the overall price level on the market for money. ? 12 Money Supply 10 Money Demand Money Supply INTEREST RATE (Percent) 0 0 20 Money Demand 40 60 80 100 MONEY (Billions of dollars) 120
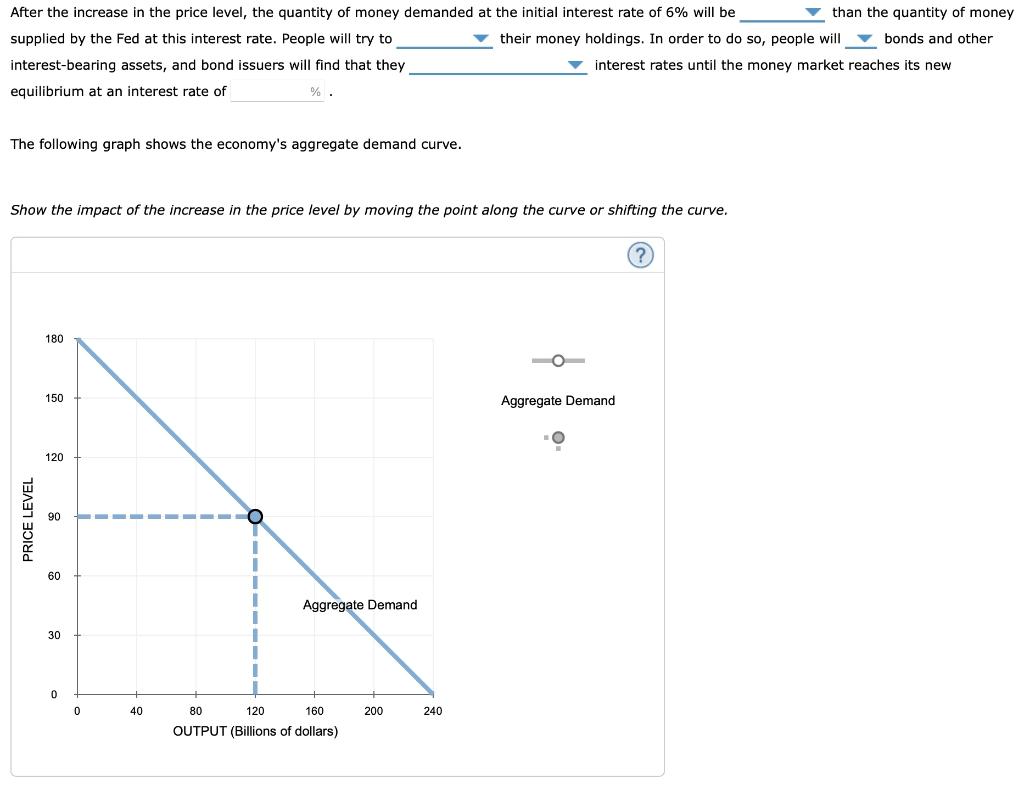
After the increase in the price level, the quantity of money demanded at the initial interest rate of 6% will be supplied by the Fed at this interest rate. People will try to interest-bearing assets, and bond issuers will find that they equilibrium at an interest rate of %. The following graph shows the economy's aggregate demand curve. Show the impact of the increase in the price level by moving the point along the curve or shifting the curve. ? 180 150 Aggregate Demand 120 90 I 60 30 0 PRICE LEVEL 0 40 Aggregate Demand 1 80 120 160 200 OUTPUT (Billions of dollars) 240 than the quantity of money bonds and other their money holdings. In order to do so, people will interest rates until the money market reaches its new
The change in the interest rate that you found previously will cause residential and business investment spending to 1 to in the quantity of output demanded in the economy. leading