Home /
Expert Answers /
Finance /
the-following-graph-shows-the-externalities-in-the-market-of-inoculation-apparently-there-are-posi-pa269
(Solved): The following graph shows the externalities in the market of inoculation. Apparently, there are posi ...
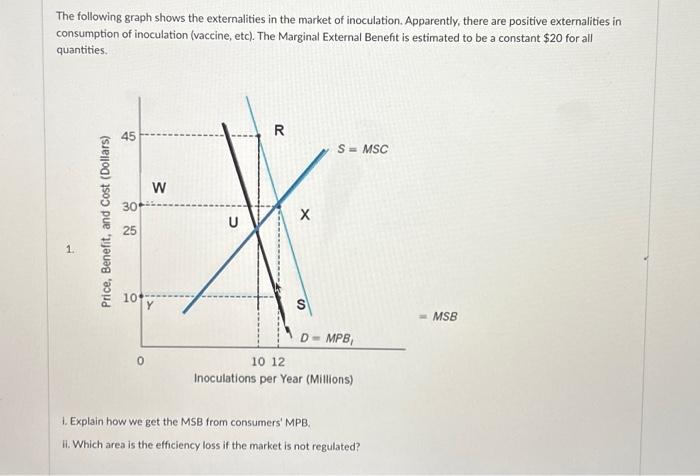
The following graph shows the externalities in the market of inoculation. Apparently, there are positive externalities in consumption of inoculation (vaccine, etc). The Marginal External Benefit is estimated to be a constant $20 for all quantities. 1. Price, Benefit, and Cost (Dollars) 45 30 25 10 W Y U R X S S = MSC D = MPB, 10 12 Inoculations per Year (Millions) i. Explain how we get the MSB from consumers' MPB. ii. Which area is the efficiency loss if the market is not regulated? = MSB
The following graph shows the externalities in the market of inoculation. Apparently, there are positive externalities in consumption of inoculation (vaccine, etc). The Marginal External Benefit is estimated to be a constant for all quantities. 1. Explain how we get the MSB from consumers' MPB. ii. Which area is the efficiency loss if the market is not regulated?