Home /
Expert Answers /
Economics /
the-following-graph-shows-the-annual-market-for-michigan-blueberries-which-are-sold-in-units-of-50-pa755
(Solved): The following graph shows the annual market for Michigan blueberries, which are sold in units of 50 ...
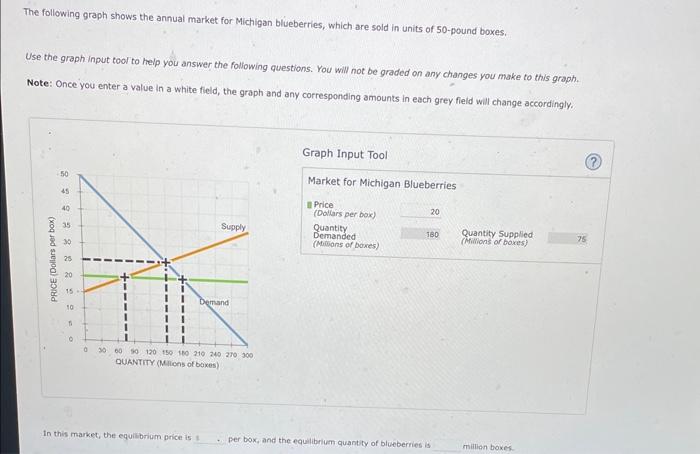
The following graph shows the annual market for Michigan blueberries, which are sold in units of 50-pound boxes. Use the graph input tool to help you answer the following questions. You will not be graded on any changes you make to this graph. Note: Once you enter a value in a white field, the groph and any corresponding amounts in each grey field will change accordingly. Graph Input Tool Market for Michigan Blueberries It Price (Oollars per box) Quantity Demanded (Muinans of boxes) Quantity Supplied: (Minlinons ar bovest) In this market, the equilibrium price is per box, and the equalibrium quantity of bluebernies is militon boxes.
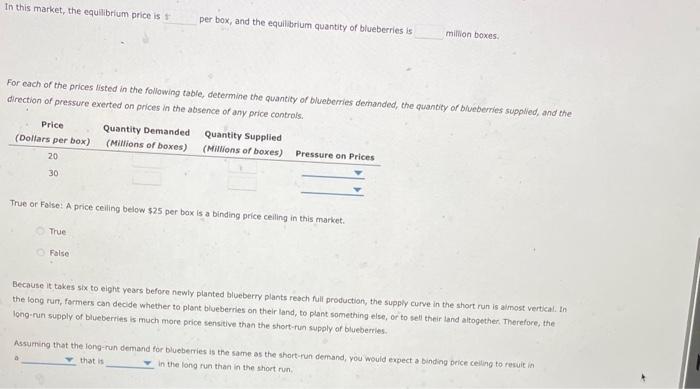
In this market, the equilibrium price is per box, and the equilibrium quantity of blueberries is milion boxes. For each of the prices listed in the following table, determine the quantity of blueberries demanded, the quantity of biveberries supplied, and the direction of pressure exerted on prices in the absence of any orice marraic. True or Folse: A price ceiling below per box is a binding price ceiling in this tharket. True False Beclause it takes six to elght years before newly planted blueberry plants feach full production, the supply curve in the short run is aimost vertical. In the long run, farmers can decide whether to plant blueberries on their land, to plant something else, or to sell their land altogether, Therefore, the long-run supply of blueberries is much more price sensitive than the stiort-run supply of blueberries. Assurning that the long-run demand for blueberries is the same as the short-run demand, you would expect a binding beice celing to resuit in a that is in the long fun than in the short run.
Expert Answer
When the price is 20, then demand is 180. Supply is 75. There is an excess demand of the goods by 180–75= 105.