Home /
Expert Answers /
Computer Science /
the-following-graph-shows-the-amount-and-change-in-daly-sloep-averaged-by-day-of-the-week-the-lef-pa388
(Solved): The following graph shows the amount and change in daly sloep, averaged by day of the week. The lef ...

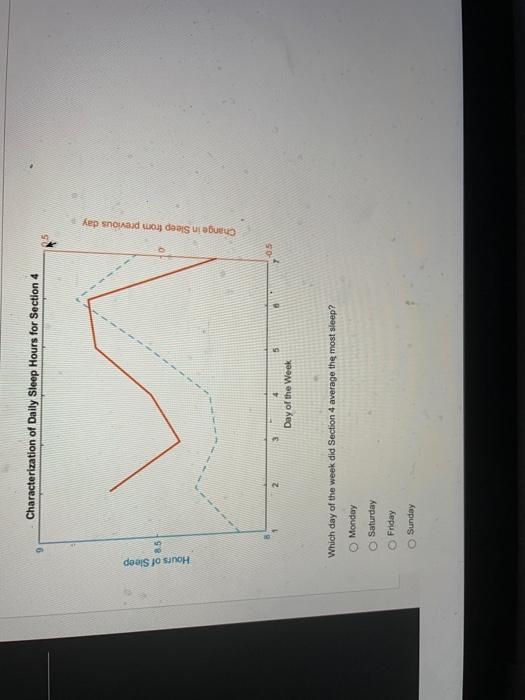
The following graph shows the amount and change in daly sloep, averaged by day of the week. The left side of the graph (dashed) is the average hours of daly sieeg, and the nght side of the graph (solid) shows the change in hours from the previous night. The data has been modifed so that Monday is the first day on the graph, and Sunday is the last. Which day of the woek did Socton 4 average the most winep? Monday Saturday
Which day of the week did Section 4 average the most sleep? Monday Saturday Friday Sunday
Expert Answer
Interpretation of the question Interpretation of the question As per the graph the following points are given :- This graph