Home /
Expert Answers /
Economics /
the-following-graph-shows-the-aggregate-demand-ad-and-aggregate-supply-as-curves-for-a-hypothet-pa805
(Solved): The following graph shows the aggregate demand (AD) and aggregate supply (AS) curves for a hypothet ...
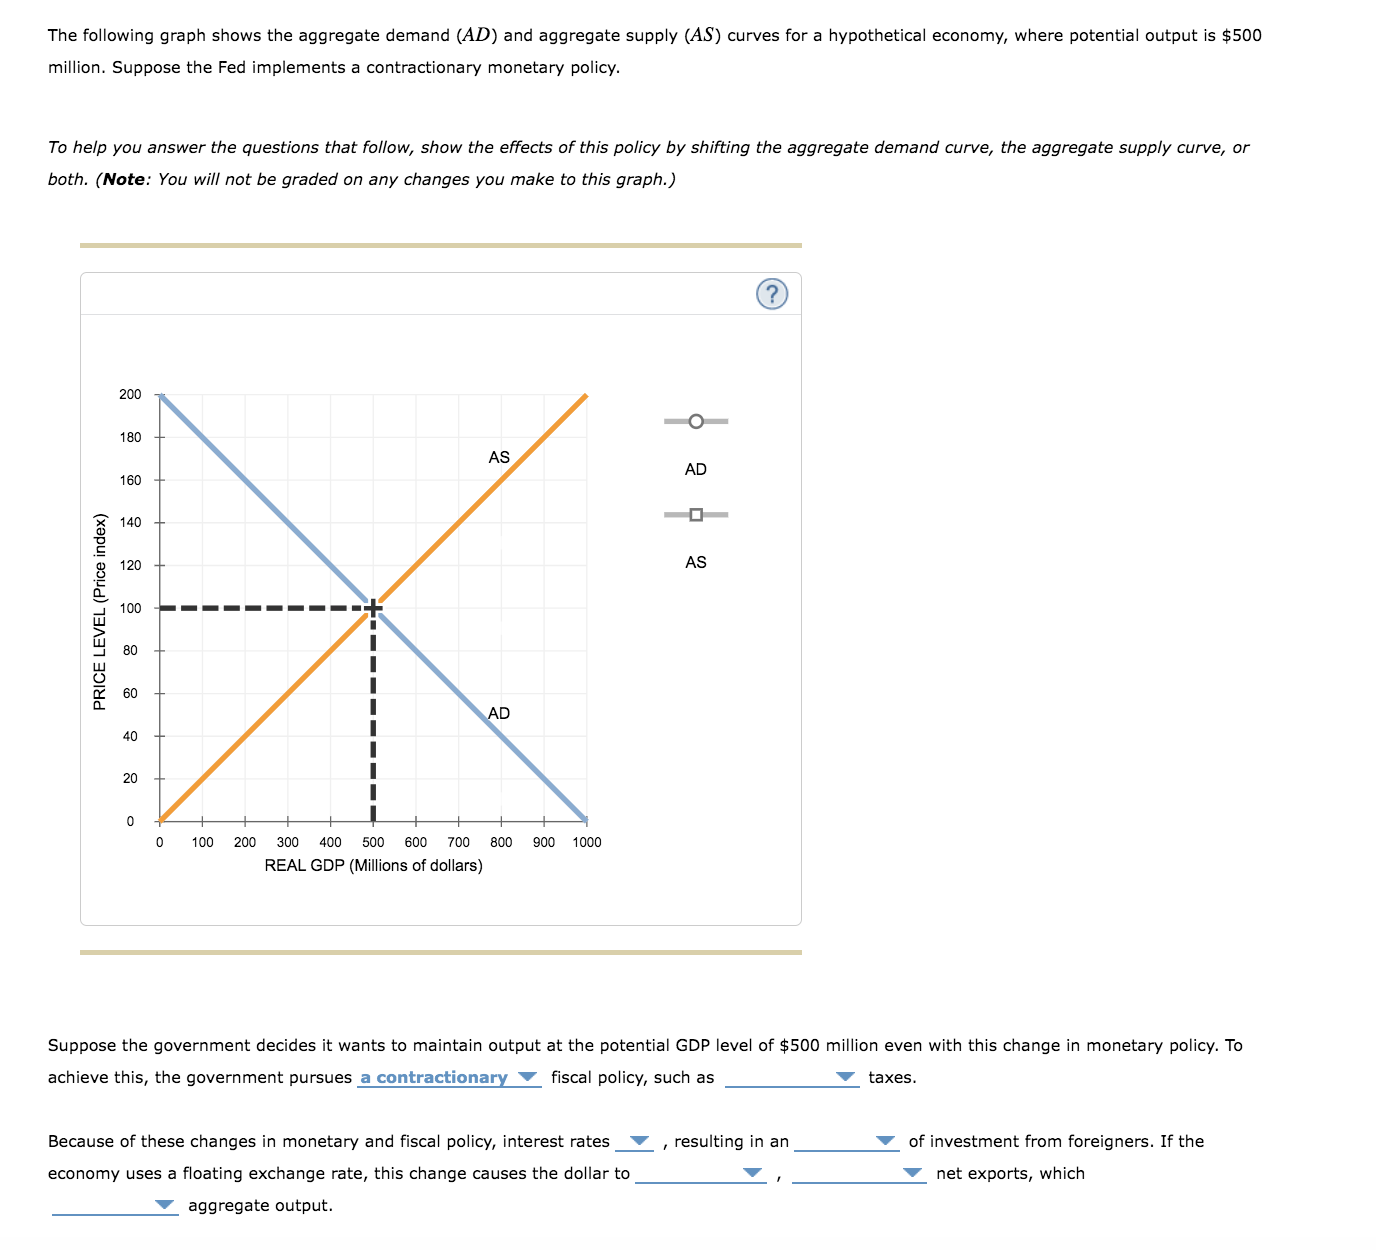
The following graph shows the aggregate demand and aggregate supply curves for a hypothetical economy, where potential output is million. Suppose the Fed implements a contractionary monetary policy. To help you answer the questions that follow, show the effects of this policy by shifting the aggregate demand curve, the aggregate supply curve, or both. (Note: You will not be graded on any changes you make to this graph.) Suppose the government decides it wants to maintain output at the potential GDP level of million even with this change in monetary policy. To achieve this, the government pursues fiscal policy, such as taxes. Because of these changes in monetary and fiscal policy, interest rates, resulting in an of investment from foreigners. If the economy uses a floating exchange rate, this change causes the dollar to net exports, which aggregate output.