Home /
Expert Answers /
Economics /
the-following-graph-shows-labor-markets-in-the-united-states-and-mexico-the-horizontal-axis-denote-pa918
(Solved): The following graph shows labor markets in the United States and Mexico, The horizontal axis denote ...
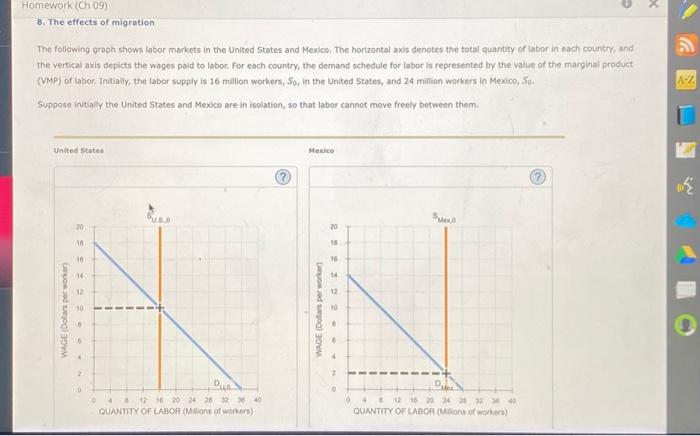
The following graph shows labor markets in the United States and Mexico, The horizontal axis denotes the total quantity of labor in each country, and the vertical axis depicts the wages paid to labor. For each country, the demand schedule for labor is represented by the value of the marglnal product (VMP) of (abor, Initially, the labor supply is 16 million workers, , in the United States, and 24 million workers in Medico, . Suppose initlaly the United States and Mexco are in isolation, so that labor cannot move freely between them. United States Mexice
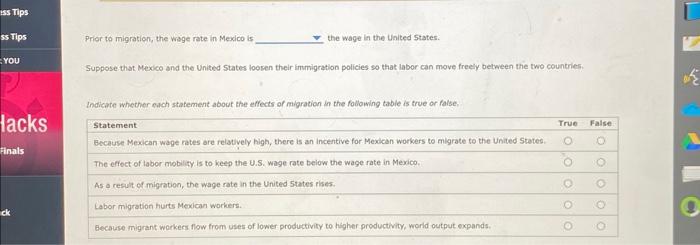
Prior to migration, the wage rate in Mexico is the wage in the United States. Suppose that Mexico and the United States loosen their imumigration policies so that labor can move freeif between the two countries. Indicate whether euch statement about the effects of migration in the following table is true or false.