Home /
Expert Answers /
Economics /
the-following-graph-shows-a-decrease-in-aggregate-demand-in-a-hypothetical-country-specifically-pa173
(Solved): The following graph shows a decrease in aggregate demand in a hypothetical country. Specifically, ...
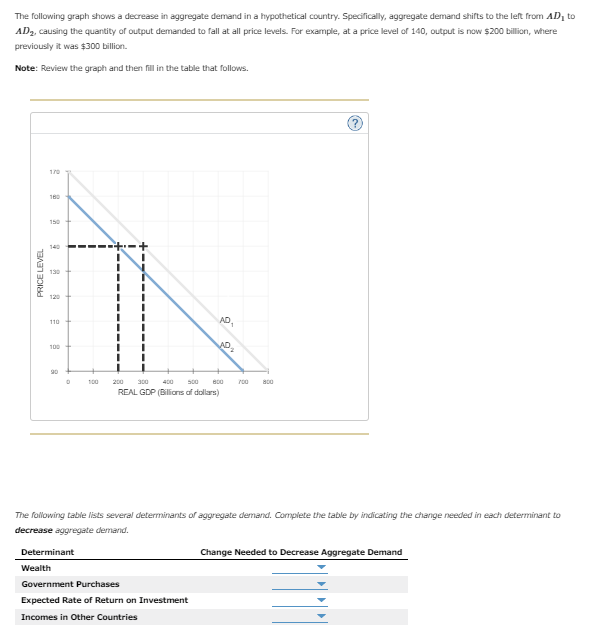
The following graph shows a decrease in aggregate demand in a hypothetical country. Specifically, aggregate demand shifts to the left from AD? to AD?, causing the quantity of output demanded to fall at all price levels. For example, at a price level of 140, output is now $200 billion, where previously it was $300 billion. Note: Review the graph and then fill in the table that follows. 1/0 160 150 130 120 110 100 2 90 500 800 700 800 200 300 REAL GDP (Billions of dollars) The following table lists several determinants of aggregate demand. Complete the table by indicating the change needed in each determinant to decrease aggregate demand. Determinant Change Needed to Decrease Aggregate Demand Wealth Government Purchases Expected Rate of Return on Investment Incomes in Other Countries 5 PRICE LEVEL 100 (2)
Expert Answer
Wealth: Decrease in wealth causes a decrease in autonomous consumption which leads to a decrease in aggregate demand
