Home /
Expert Answers /
Economics /
the-following-graph-shows-a-competitive-labor-market-based-on-the-graph-the-total-amount-paid-to-pa999
(Solved): The following graph shows a competitive labor market. Based on the graph, the total amount paid to ...
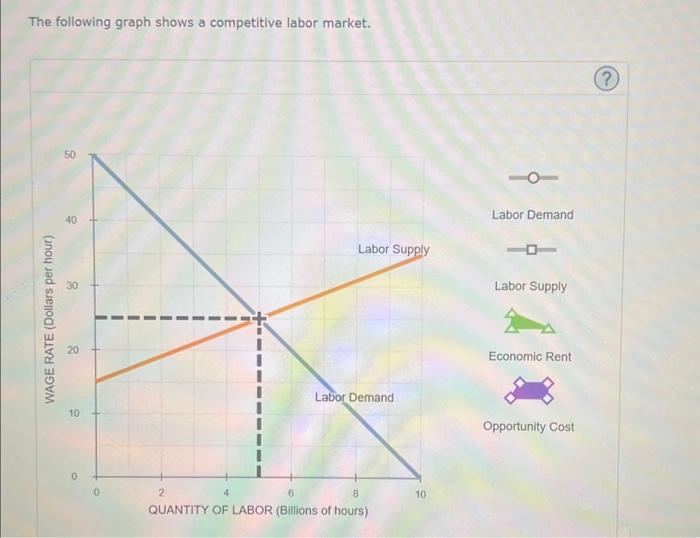
The following graph shows a competitive labor market.
Based on the graph, the total amount paid to workers in this market (that is, total labor earnings) is On the graph, use the green thiangle (triangle symbols) to shade the portion of labor earnings that consists of economic rent. Then, use the purple quadrilateral (diamond symbols) to shade the portion of labor carnings that consists of opportunity cost.
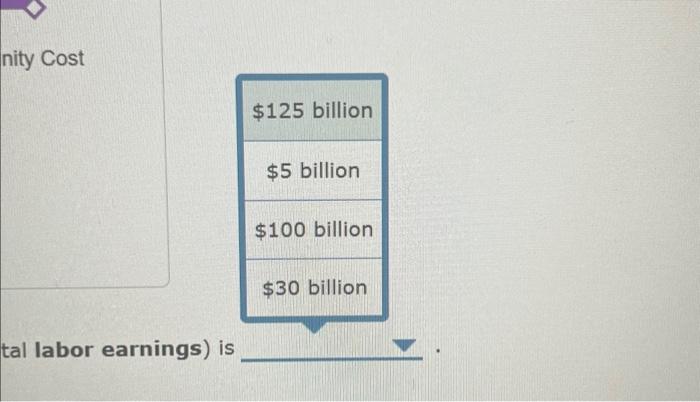
tal labor earnings) is