Home /
Expert Answers /
Chemistry /
the-following-graph-represents-two-spectrophotometric-calibration-curves-obtained-at-two-wavelengths-pa935
(Solved): The following graph represents two spectrophotometric calibration curves obtained at two wavelengths ...
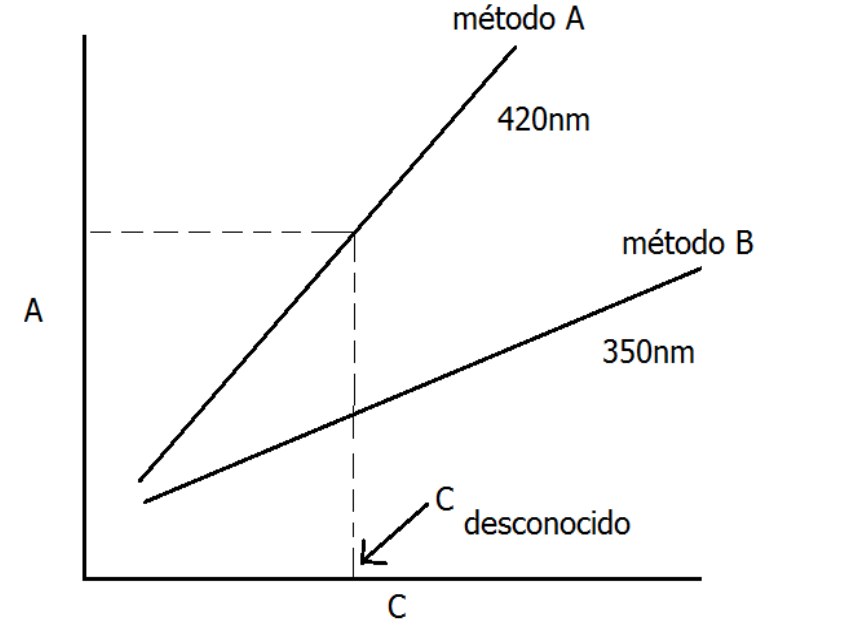
The following graph represents two spectrophotometric calibration curves obtained at two wavelengths. Based on this information, determine whether the following statements are true (C) or false (F):
a. The analytical sensitivity is different in both curves_____
b. the S/N ratio of the standard solution response is expected to be greater than 420nm_____
c. the sensitivity of method A is less than that of method B_____
d. the detection limit of method A is expected to be less than the detection limit of method B_____
e. the determination of the concentration of the unknown cannot be carried out by both methods._____
Expert Answer
Answer : . . As per the data : . a. False Because in this case B has more sensitivity than A b. Tr