Home /
Expert Answers /
Economics /
the-following-graph-plots-the-market-for-scones-in-denver-where-there-are-always-over-1-000-bakeri-pa475
(Solved): The following graph plots the market for scones in Denver, where there are always over 1,000 bakeri ...
The following graph plots the market for scones in Denver, where there are always over 1,000 bakeries. Suppose the municipal government sharply increases local taxes, making it significantly more expensive to reside within Denver city limits. Many residents decide to leave the city altogether for areas with lower local tax rates.
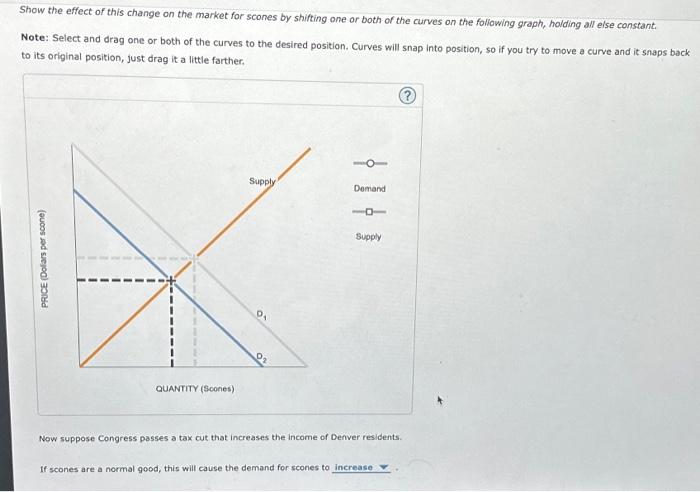
Show the effect of this change on the market for scones by shifting one or both of the curves on the following graph, holding all eise constant. Note: Select and drag one or both of the curves to the desired position. Curves will snap into position, so if you try to move a curve and it snaps back to its original position, just drag it a little farther. Now suppose Congress passes a tax cut that increases the income of Derver residents. If scones are a normal good, this will cause the demand for scones to
Expert Answer
The elements affecting supply and demand in a market economy are called market forces. The price ...