Home /
Expert Answers /
Finance /
the-following-graph-plots-the-current-security-market-line-sml-and-indicates-the-retum-that-inves-pa167
(Solved): The following graph plots the current security market line (SML) and indicates the retum that inves ...
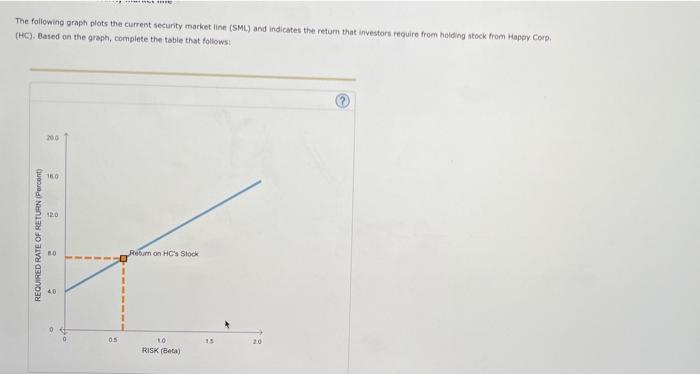
The following graph plots the current security market line (SML) and indicates the retum that investors require from holding stock from Happy Coep. (HC), Based on the graph, complete the table that follows:
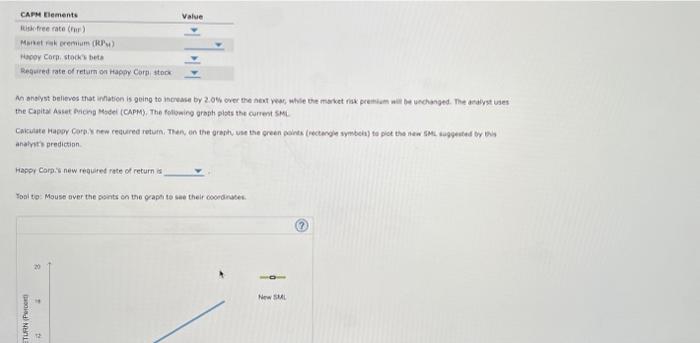
An bhoyst believos that infabien is geing to incrake by \( 2.0 \% \) over the hent par, whle the market fak premium ait be urehanged. The aralyst uses analyst predictinn. Haspy Cora:' new reaisied rate of return is Toal to: Mause aver the points on the graph te sae their oocedrages.
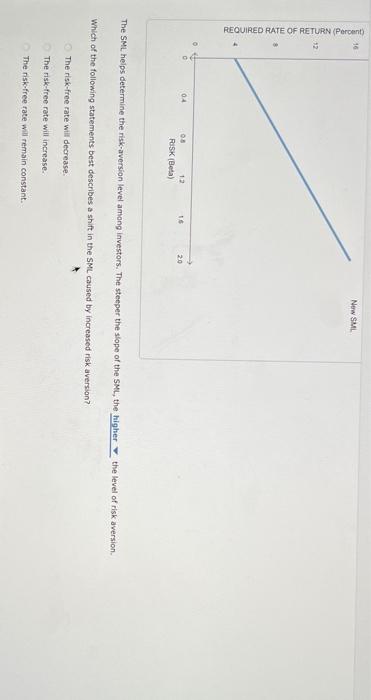
The SML helps determine the risk-aversion level among investors. The steeper the slope of the SML, the the level of risk aversion. Which of the following statements best describes a shift in the SML caused by increased risk aversion? The risk-free rate will decrease. The risk-free rate will increase. The nsk-free rate will remain constant.
Expert Answer
Solution: risk free rate = 5.0% market risk premium (RPm) = 4.5% happy corp stock's beta = 1.2 Required rate of return on Happy corp stock 10.4% Happy