Home /
Expert Answers /
Economics /
the-following-graph-plote-the-short-run-phillips-curve-for-a-hypothetical-economy-the-given-point-pa351
(Solved): The following graph plote the short-run Phillips curve for a hypothetical economy. The given point ...
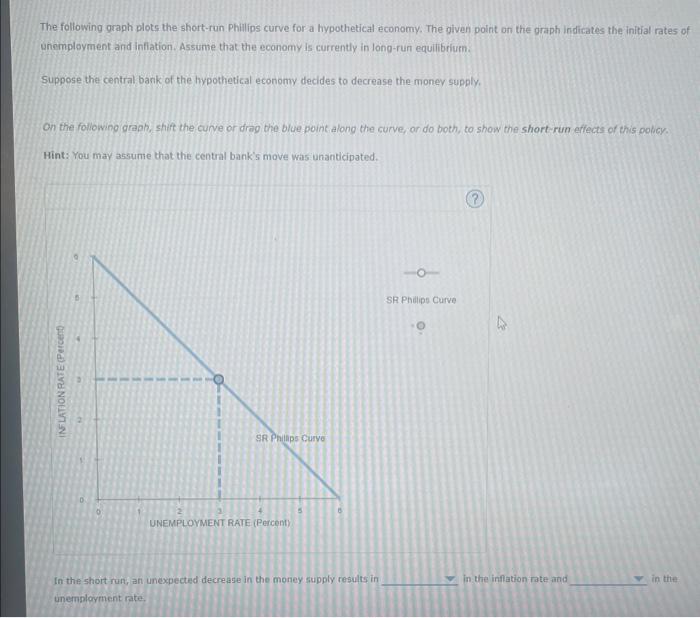
The following graph plote the short-run Phillips curve for a hypothetical economy. The given point on the oraph indicates the initial rates of unsmployment and infiation. Assume that the economy is currently in long-run equilibrium. Suppose the central bank of the hypothetical economy decides to decrease the money supply. On the following graph, shift the curve or drag the blue point along the curve, an do both, to show the short rum effects of this policy. Hint: You may assume that the central bank's move was unanticipated. In the shoit run, an unexpected decrease in the money supply results in in the inflation rate and unernoloyment rate.
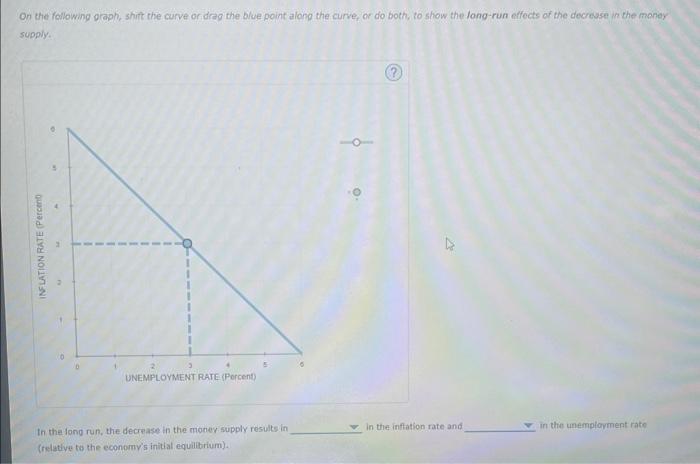
On the following graph, shift the curve or drag the blue point along the curve, or do both, to show the long-run effects of the decresse in the maney supply. In the fong run, the decrease in the money supply results in in the inflation rate and (relative to the economv's initial equilibrium).
Expert Answer
(Part 1) A decrease in money supply, which lowers the aggregate d