Home /
Expert Answers /
Economics /
the-following-graph-gives-the-labor-market-for-the-fast-food-industry-of-the-imaginary-city-of-comb-pa734
(Solved): The following graph gives the labor market for the fast-food industry of the imaginary city of Comb ...
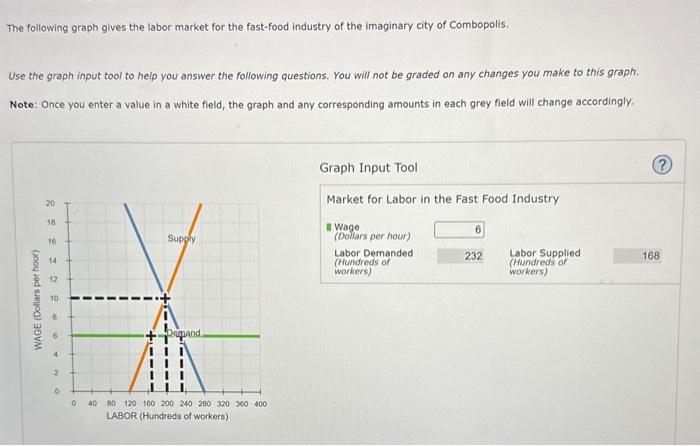
The following graph gives the labor market for the fast-food industry of the imaginary city of Combopolis. Use the graph input tool to help you answer the following questions. You will not be graded on any changes you make to this graph. Note: Once you enter a value in a white field, the graph and any corresponding amounts in each grey field will change accordingly.
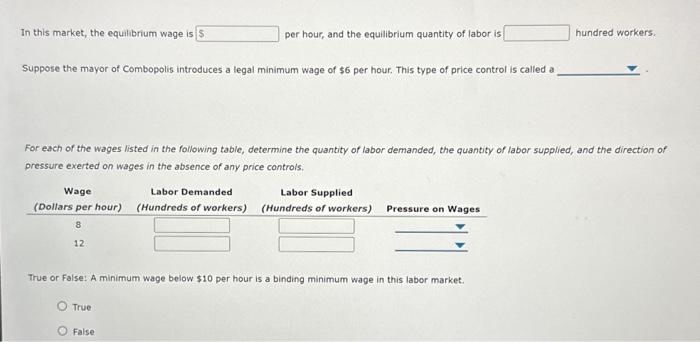
In this market, the equilbrium wage is per hour, and the equilibrium quantity of labor is hundred workers. Suppose the mayor of Combopolis introduces a legal minimum wage of per hour. This type of price control is called a For each of the wages listed in the following table, determine the quantity of labor demanded, the quantity of labor supplied, and the direction of pressure exerted on wages in the absence of any price controis. True or False: A minimum wage below per hour is a binding minimum wage in this labor market. True False
Expert Answer
Ans Step-1The equilibrium point occurs when demand and supply curve intersect to each other.So e