Home /
Expert Answers /
Operations Management /
the-following-diagram-shows-a-4-step-process-that-begins-with-operation-1-and-ends-with-operation-4-pa707
(Solved): The following diagram shows a 4-step process that begins with Operation 1 and ends with Operation 4 ...
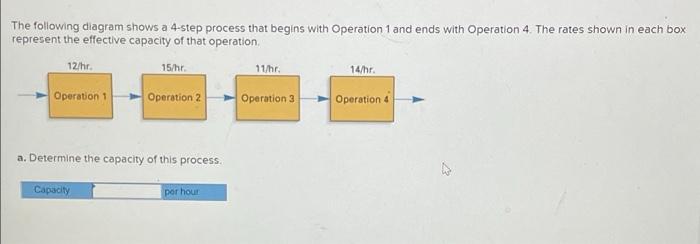
The following diagram shows a 4-step process that begins with Operation 1 and ends with Operation 4. The rates shown in each box represent the effective capacity of that operation. 12/hr. 15/hr. Operation 2 Operation 1 a. Determine the capacity of this process. Capacity por hour 11/hr. Operation 3 14/hr. Operation 4
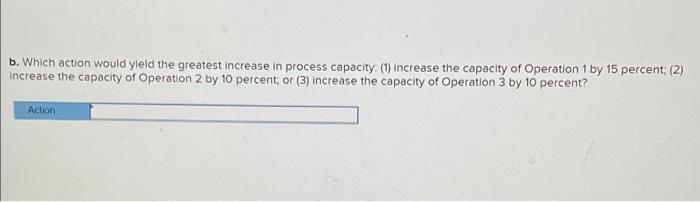
b. Which action would yield the greatest increase in process capacity: (1) increase the capacity of Operation 1 by 15 percent; (2) increase the capacity of Operation 2 by 10 percent; or (3) increase the capacity of Operation 3 by 10 percent? Action