Home /
Expert Answers /
Finance /
the-following-diagram-depicts-the-npv-profile-for-an-investment-that-costs-pa152
(Solved): The following diagram depicts the NPV profile for an investment that costs \( ...

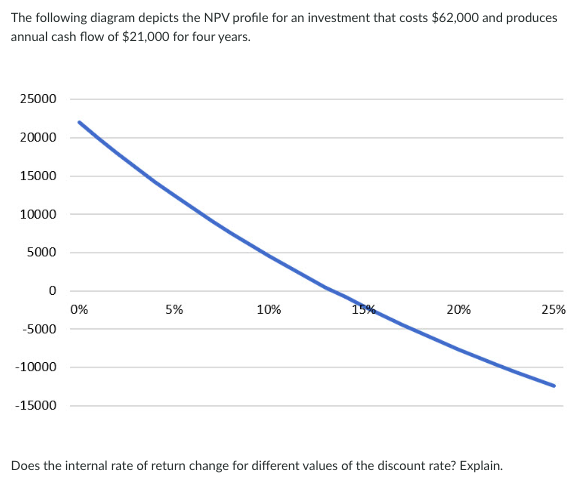
The following diagram depicts the NPV profile for an investment that costs \( \$ 62,000 \) and produces annual cash flow of \( \$ 21,000 \) for four years. Does the internal rate of return change for different values of the discount rate? Explain.
Expert Answer
This solution was written by