Home /
Expert Answers /
Statistics and Probability /
the-following-data-represent-the-daily-demand-y-in-thousands-of-units-and-the-unit-price-pa704
(Solved): The following data represent the daily demand ( \( y \) in thousands of units) and the unit price ...
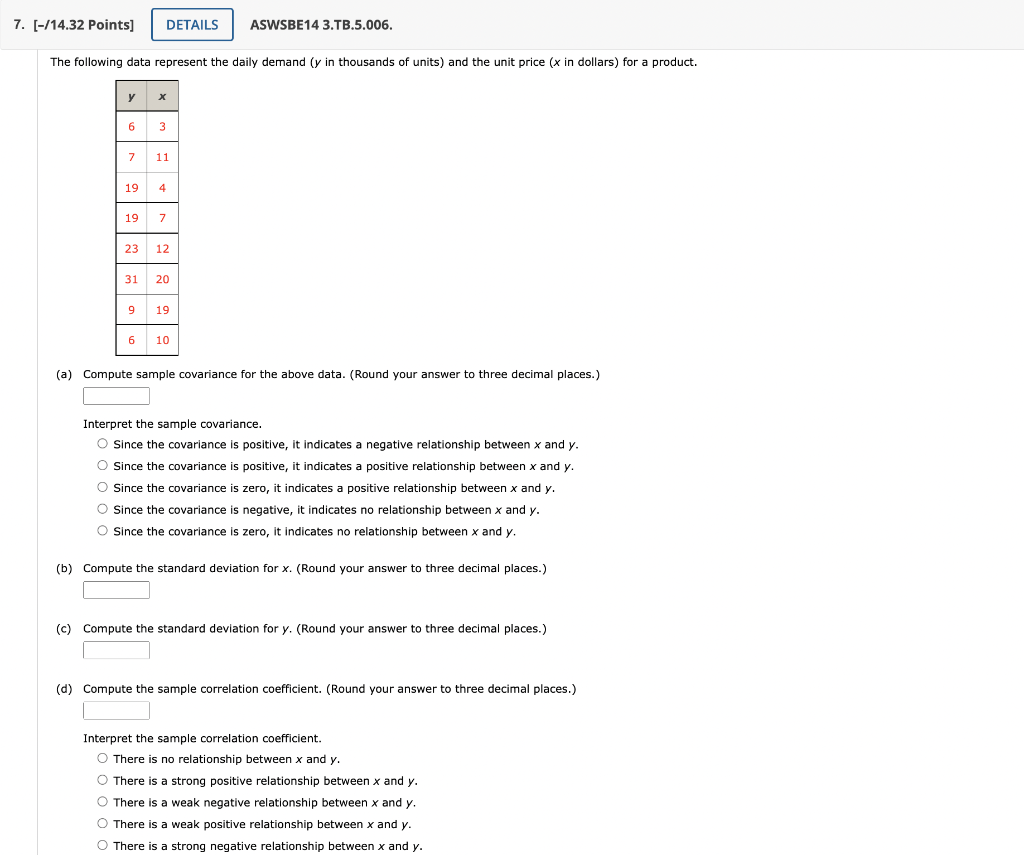
The following data represent the daily demand ( \( y \) in thousands of units) and the unit price ( \( x \) in dollars) for a product. (a) Compute sample covariance for the above data. (Round your answer to three decimal places.) Interpret the sample covariance. Since the covariance is positive, it indicates a negative relationship between \( x \) and \( y \). Since the covariance is positive, it indicates a positive relationship between \( x \) and \( y \). Since the covariance is zero, it indicates a positive relationship between \( x \) and \( y \). Since the covariance is negative, it indicates no relationship between \( x \) and \( y \). Since the covariance is zero, it indicates no relationship between \( x \) and \( y \). (b) Compute the standard deviation for \( x \). (Round your answer to three decimal places.) (c) Compute the standard deviation for \( y \). (Round your answer to three decimal places.) (d) Compute the sample correlation coefficient. (Round your answer to three decimal places.) Interpret the sample correlation coefficient. There is no relationship between \( x \) and \( y \). There is a strong positive relationship between \( x \) and \( y \). There is a weak negative relationship between \( x \) and \( y \). There is a weak positive relationship between \( x \) and \( y \).
Expert Answer
Calculating various parameters as shown below a) Sample covar
