Home /
Expert Answers /
Statistics and Probability /
the-following-contingency-table-shows-three-different-sections-taught-by-three-different-instructo-pa859
(Solved): The following contingency table shows three different sections taught by three different instructo ...
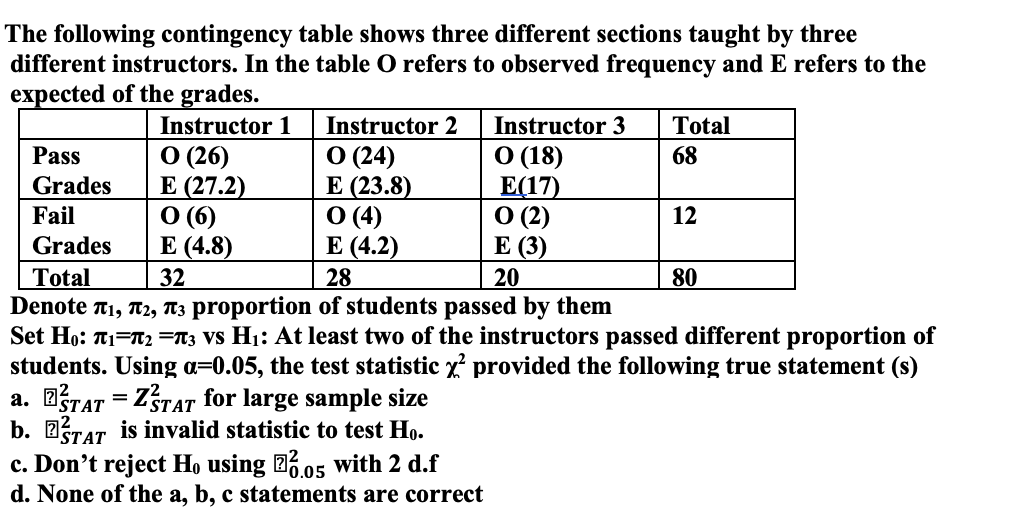
The following contingency table shows three different sections taught by three different instructors. In the table \( O \) refers to observed frequency and \( E \) refers to the expected of the grades. Denote \( \pi_{1}, \pi_{2}, \pi_{3} \) proportion of students passed by them Set \( \mathbf{H}_{0}: \pi_{1}=\pi_{2}=\pi_{3} \) vs \( \mathbf{H}_{1} \) : At least two of the instructors passed different proportion of students. Using \( \alpha=0.05 \), the test statistic \( \chi^{2} \) provided the following true statement (s) a. ? \( { }_{S T A T}^{2}=Z_{S T A T}^{2} \) for large sample size b. ? \( { }_{S T A T}^{2} \) is invalid statistic to test \( \mathbf{H}_{0} \). c. Don't reject \( \mathrm{H}_{0} \) using \( ]_{0.05}^{2} \) with 2 d.f d. None of the a, b, c statements are correct
Expert Answer
X2 test statistic Formula is; X2=?(O?E)2E X2=(26-27.2)2/27.2+(24-23.8)2/23.8+(18-1