Home /
Expert Answers /
Advanced Physics /
the-figure-shows-the-torque-applied-to-the-knee-joint-during-walking-level-ground-blue-curve-and-pa650
(Solved): The figure shows the torque applied to the knee joint during walking level ground (blue curve) and ...
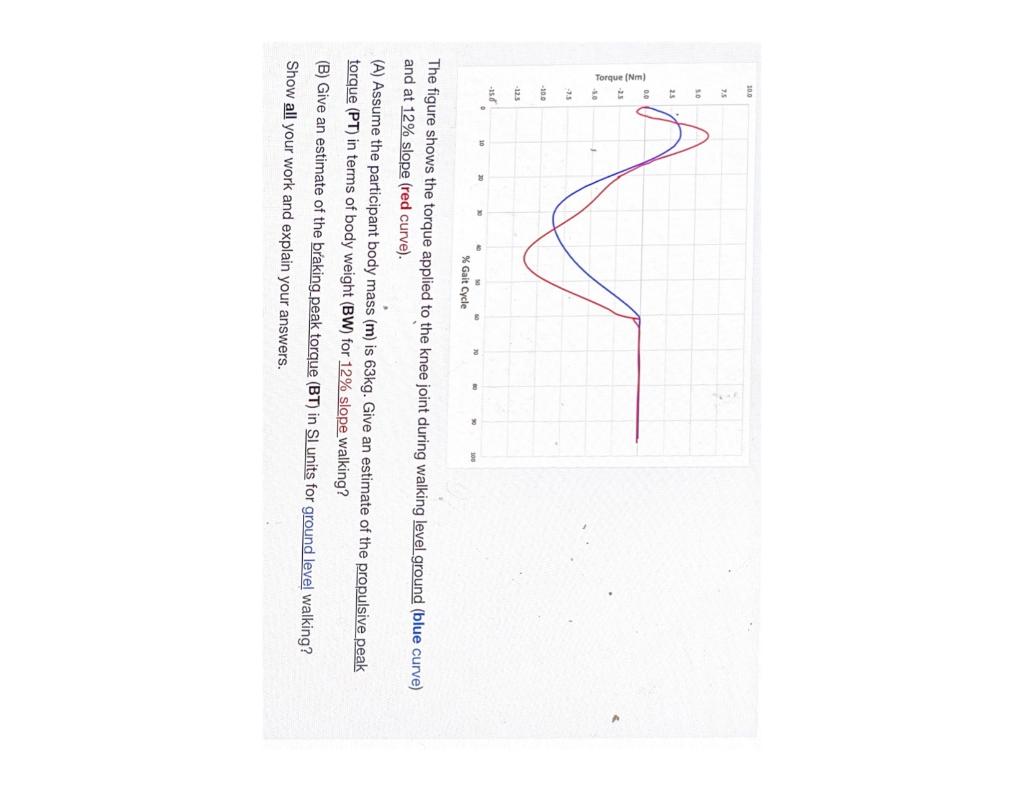
The figure shows the torque applied to the knee joint during walking level ground (blue curve) and at \( 12 \% \) slope (red curve). (A) Assume the participant body mass \( (\mathrm{m}) \) is \( 63 \mathrm{~kg} \). Give an estimate of the propulsive peak torque (PT) in terms of body weight (BW) for \( 12 \% \) slope walking? (B) Give an estimate of the braking_peak torque (BT) in SI units for ground level walking? Show all your work and explain your answers.
