Home /
Expert Answers /
Economics /
the-figure-shows-the-marginal-private-cost-curve-marginal-social-cost-curve-and-margina-social-be-pa572
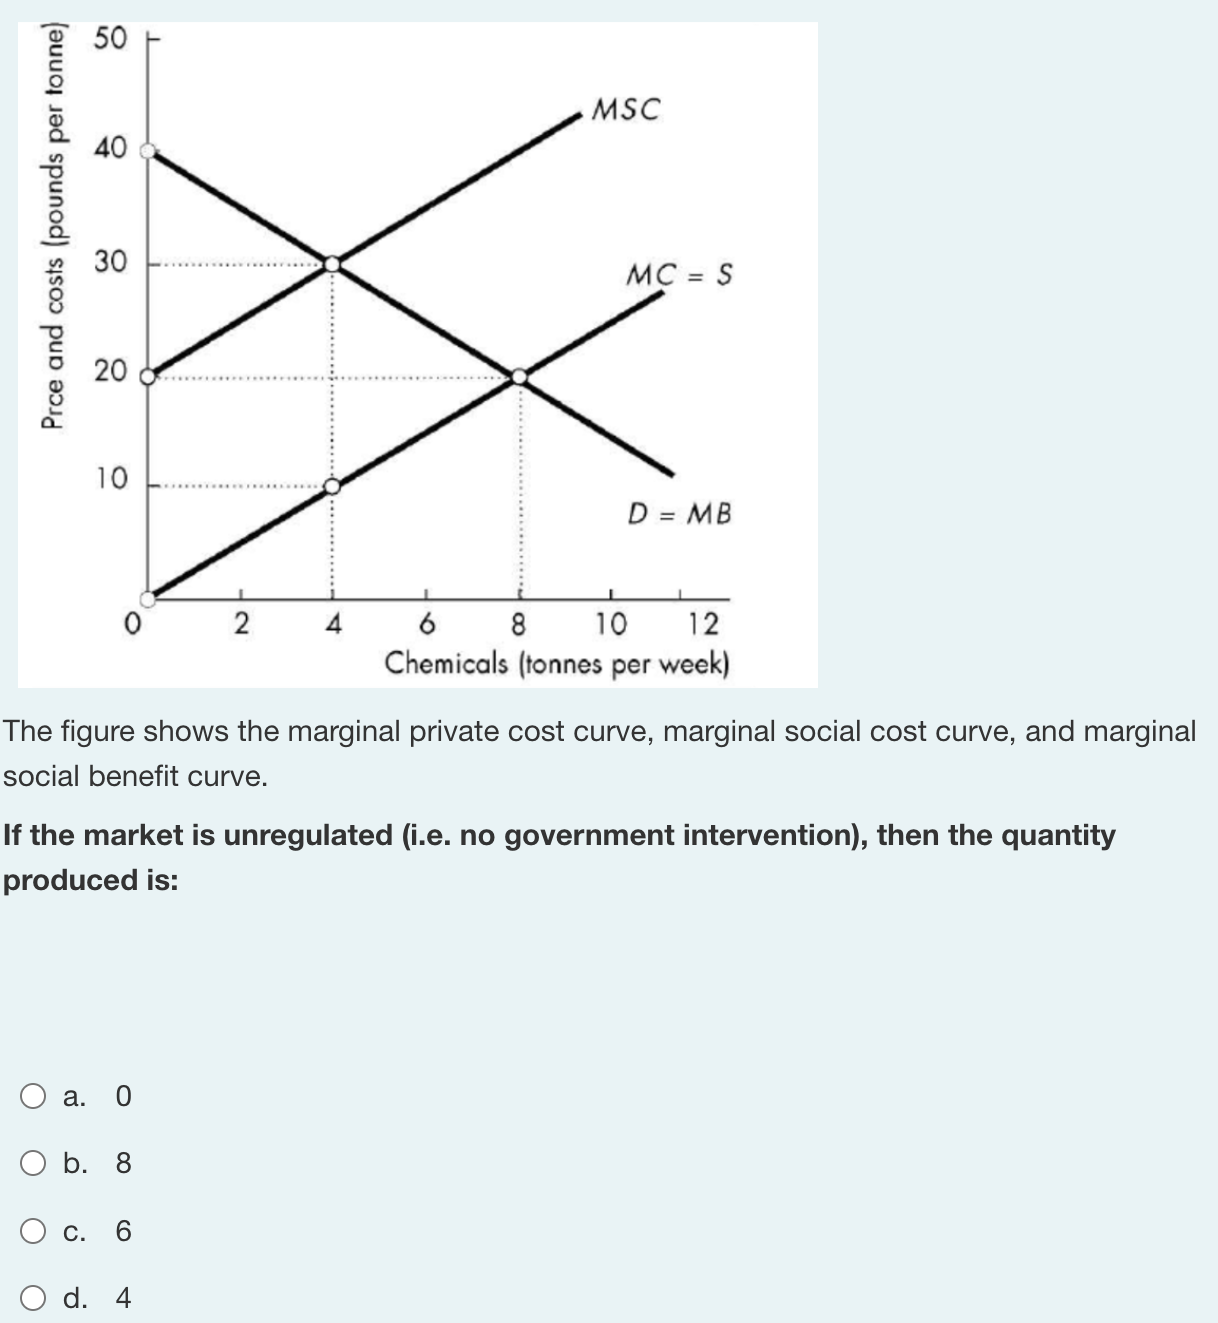
(Solved): The figure shows the marginal private cost curve, marginal social cost curve, and margina social be ...

The figure shows the marginal private cost curve, marginal social cost curve, and margina social benefit curve. If the market is unregulated (i.e. no government intervention), then the quantity produced is: a. 0 b. 8 c. 6 d. 4