Home /
Expert Answers /
Advanced Physics /
the-figure-shows-the-magnetic-flux-through-a-coil-as-a-at-what-times-shown-in-this-plot-do-the-magn-pa770
(Solved): The figure shows the magnetic flux through a coil as a At what times shown in this plot do the magn ...
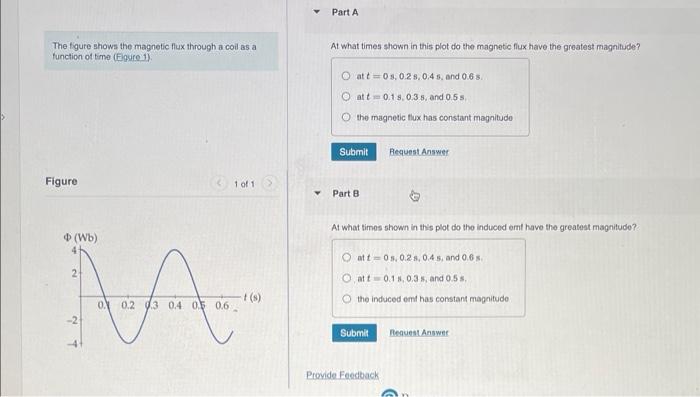
The figure shows the magnetic flux through a coil as a At what times shown in this plot do the magnetic fiux have the greatest magnitude? function of time (Equired). at \( t=0,0.2 \mathrm{~s}, 0.4 \mathrm{~s} \), and \( 0.6 \mathrm{~s} \). at \( t=0.19,0.35 \), and \( 0.5 \mathrm{~s} \), the magnetic thux has constant magnitude Figure At what times shown in this plot do the induced emt have the greatest magnitude? at \( t=0.5,0.2 \mathrm{~s}, 0.4 .5 \), and \( 0.6 \mathrm{~s} \). at \( t=0.1 \mathrm{~s}, 0.3 \mathrm{~s} \), and \( 0.5 \mathrm{~s} \). the induced emt has constant magnitude