Home /
Expert Answers /
Economics /
the-figure-shows-a-student-39-s-feasible-frontier-and-her-indifference-curves-for-final-exam-marks-a-pa137
(Solved): The figure shows a student's feasible frontier and her indifference curves for final exam marks and ...
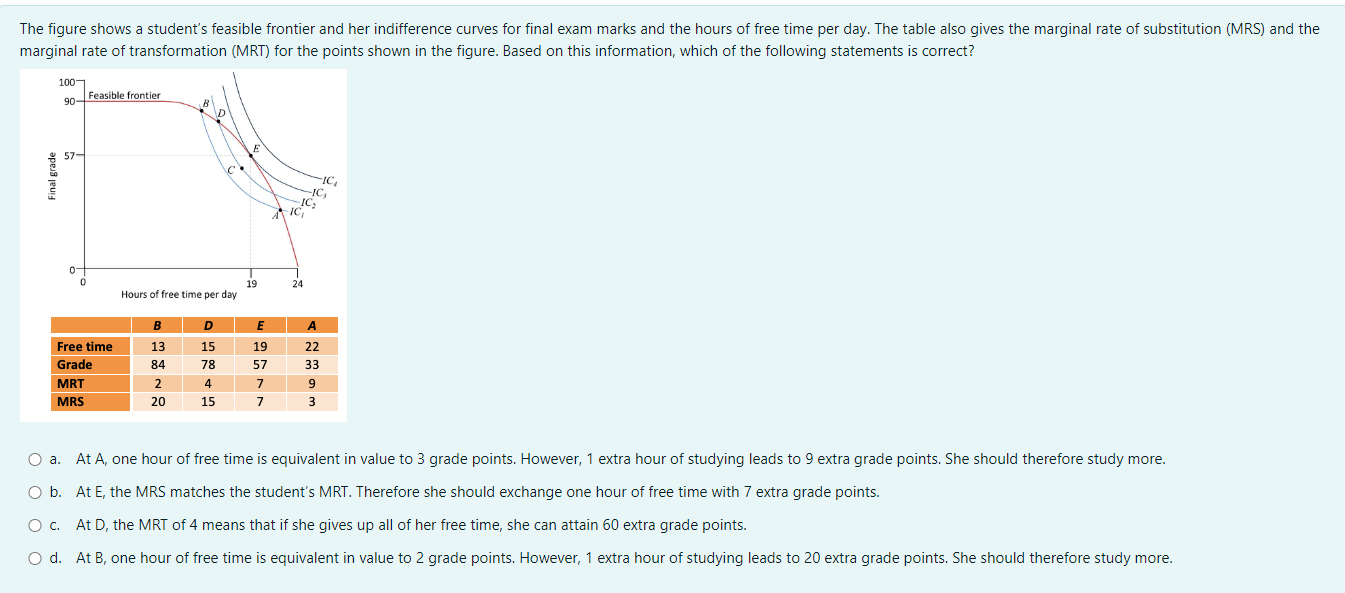
The figure shows a student's feasible frontier and her indifference curves for final exam marks and the hours of free time per day. The table also gives the marginal rate of substitution (MRS) and the marginal rate of transformation (MRT) for the points shown in the figure. Based on this information, which of the following statements is correct? a. At A, one hour of free time is equivalent in value to 3 grade points. However, 1 extra hour of studying leads to 9 extra grade points. She should therefore study more. b. At \\( E \\), the MRS matches the student's MRT. Therefore she should exchange one hour of free time with 7 extra grade points. c. At \\( D \\), the MRT of 4 means that if she gives up all of her free time, she can attain 60 extra grade points. d. At B, one hour of free time is equivalent in value to 2 grade points. However, 1 extra hour of studying leads to 20 extra grade points. She should therefore study more.