Home /
Expert Answers /
Physics /
the-figure-shows-a-potential-energy-curve-for-the-interaction-of-two-fneutral-atoms-the-two-atom-s-pa180
(Solved): The figure shows a potential energy curve for the interaction of two fneutral atoms. The two-atom s ...
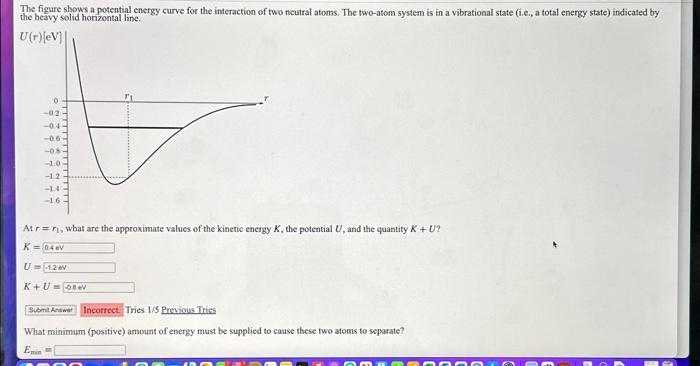
The figure shows a potential energy curve for the interaction of two fneutral atoms. The two-atom system is in a vibrational state (i.e., a total energy state) indicated by the heary solid horizontal line. At , what are the approximate values of the kinetic energy , the potential , and the quantity ? Tries 1/S Previous Tries What minimum (positive) amount of energy must be supplied to cause these two atoms to separate?