Home /
Expert Answers /
Physics /
the-figure-figure-1-is-a-graph-of-psi-x-2-for-an-electron-what-is-the-value-of-a-pa855
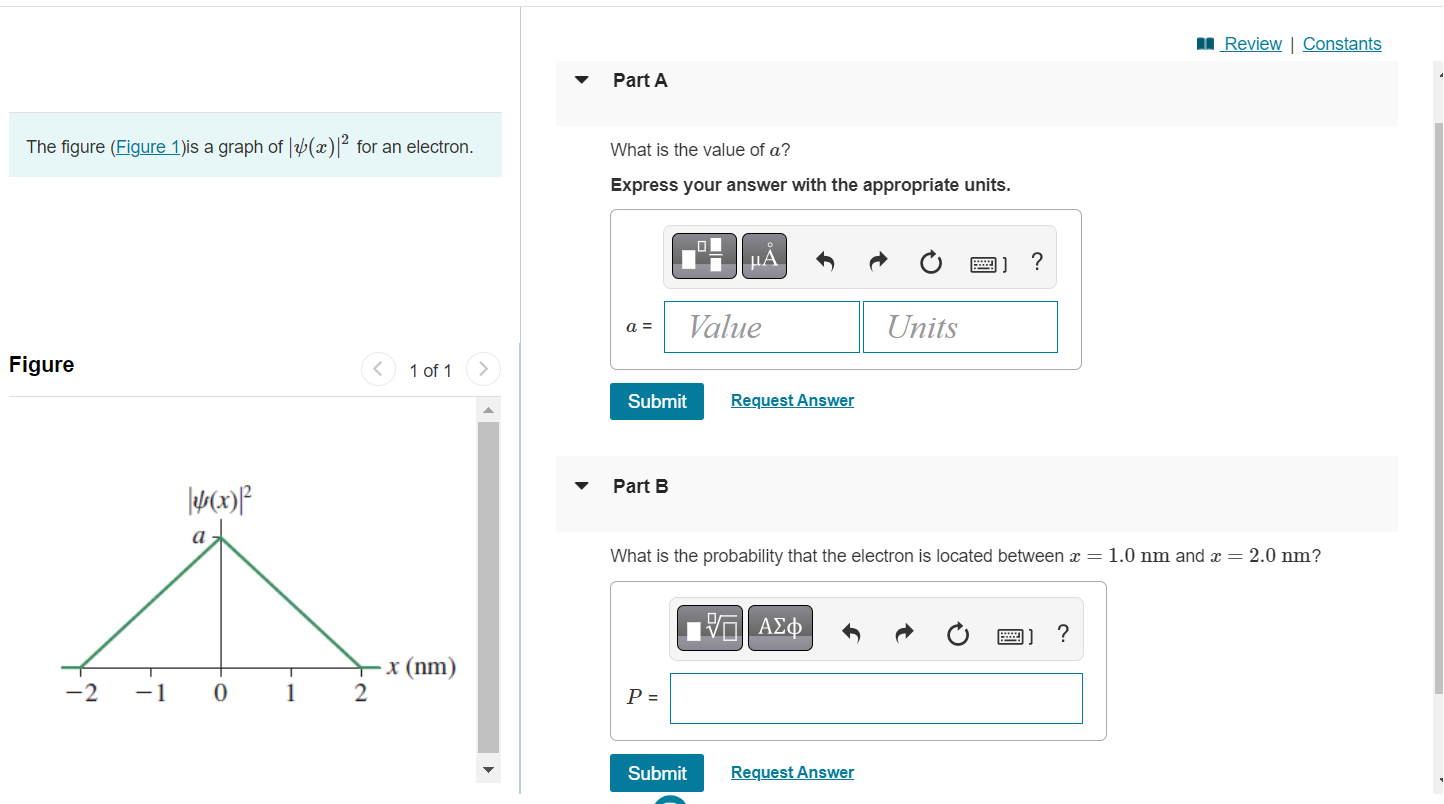
(Solved): The figure (Figure 1)is a graph of \( |\psi(x)|^{2} \) for an electron. What is the value of \( a ...
The figure (Figure 1)is a graph of \( |\psi(x)|^{2} \) for an electron. What is the value of \( a \) ? Express your answer with the appropriate units. Figure 1 of 1 Part B What is the probability that the electron is located between \( x=1.0 \mathrm{~nm} \) and \( x=2.0 \mathrm{~nm} ? \)
Expert Answer
The condition for |?(x)|2 is the area of curve must be equal to 1. Area of c
