Home /
Expert Answers /
Statistics and Probability /
the-figure-displays-the-density-curve-of-a-uniform-distribution-this-curve-takes-the-constant-val-pa217
(Solved): The figure displays the density curve of a uniform distribution. This curve takes the constant val ...
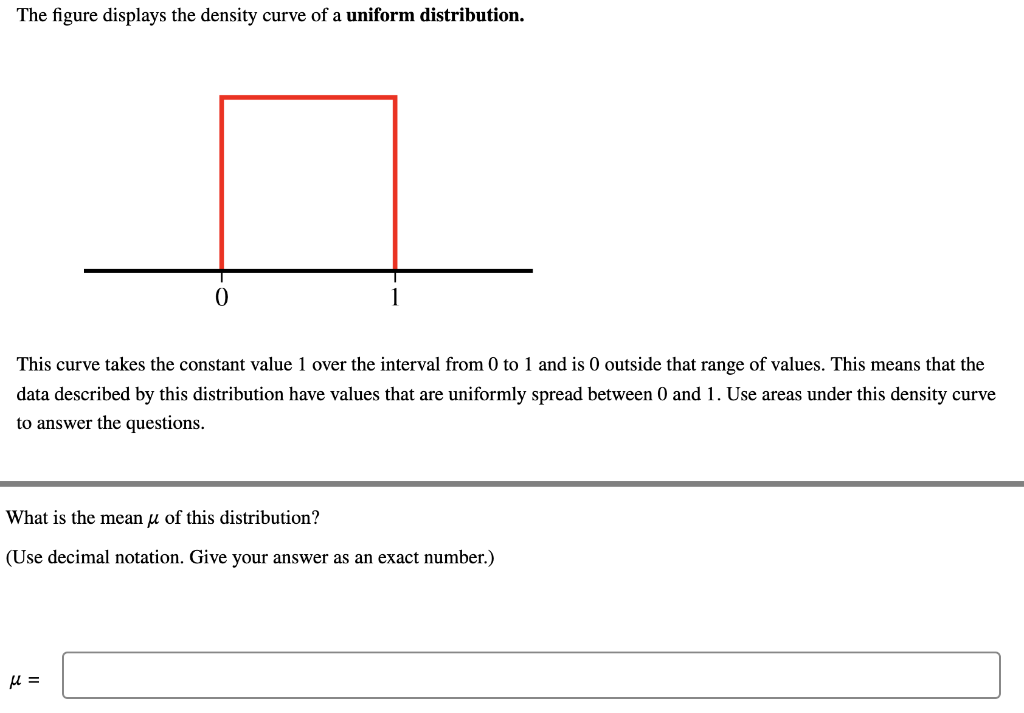
The figure displays the density curve of a uniform distribution. This curve takes the constant value 1 over the interval from 0 to 1 and is 0 outside that range of values. This means that the data described by this distribution have values that are uniformly spread between 0 and 1 . Use areas under this density curve to answer the questions. What is the mean of this distribution? (Use decimal notation. Give your answer as an exact number.)