Home /
Expert Answers /
Economics /
the-figure-below-shows-the-demand-schedule-and-demand-curve-for-a-product-produced-by-a-singlepri-pa815
(Solved): The figure below shows the demand schedule and demand curve for a product produced by a singlepri ...
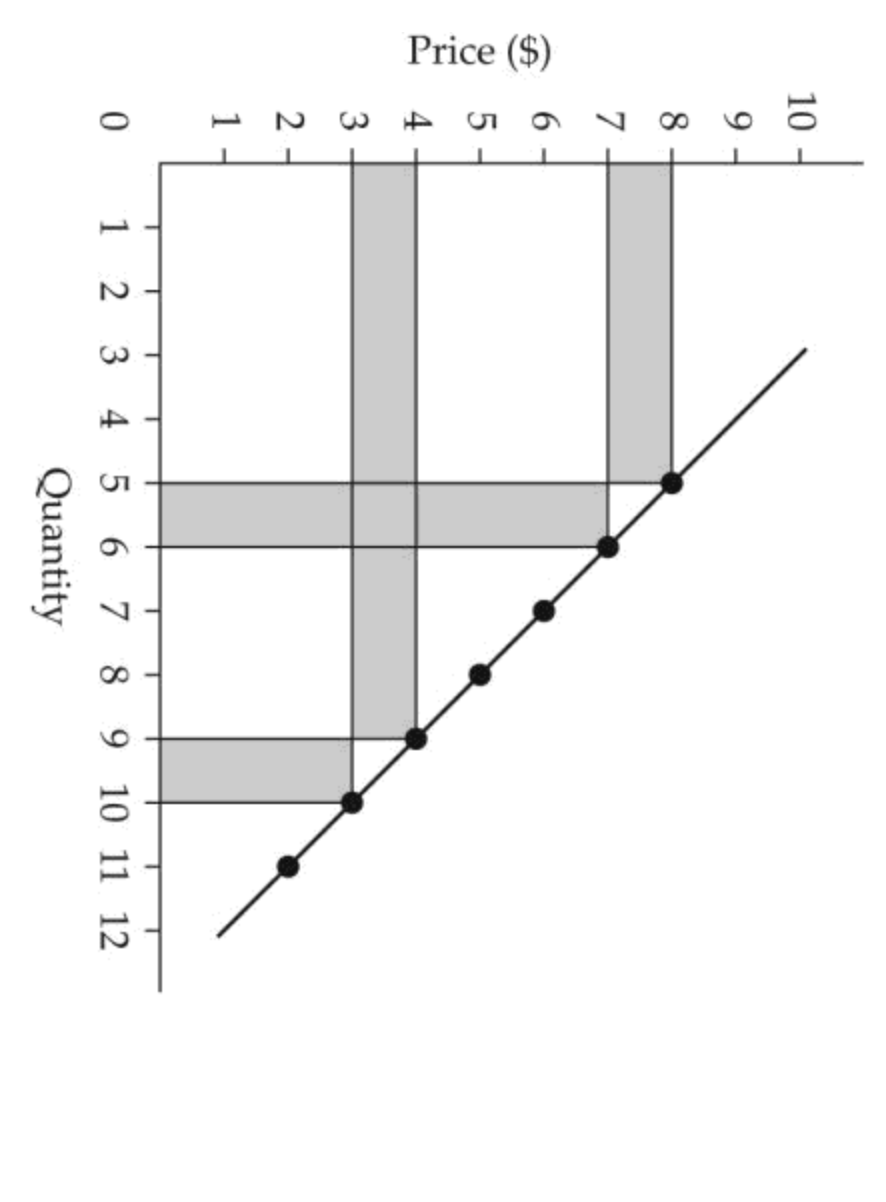
The figure below shows the demand schedule and demand curve for a product produced by a
single?price
monopolist.
FIGURE
10?1
Refer to Figure
10?1.
What is the change in total revenue for this firm as it increases output from 9 units to 10? units?
A.
?$0
B.
??$6
C.
?$6
D.
??$2
E.
?$2
Price ($) 10 9 8 7 6 5 4 3 2 1 0 1 2 3 4 5 6 7 8 9 10 11 12 Quantity
Expert Answer
Answer :B -$6 Total revenue when