Home /
Expert Answers /
Earth Sciences /
the-figure-below-shows-a-map-of-midlatitude-cyclone-the-three-green-arrows-and-one-red-arrow-indica-pa112
(Solved): The figure below shows a map of midlatitude cyclone. The three green arrows and one red arrow indica ...
The figure below shows a map of midlatitude cyclone. The three green arrows and one red arrow indicate wind direction in the cyclone. Which of the following is true?
???????A.The air temperature at Point B will increase slowly.
B.The air pressure at Point A is increasing (rising).
C.Point B and C have equal chance of precipitation.
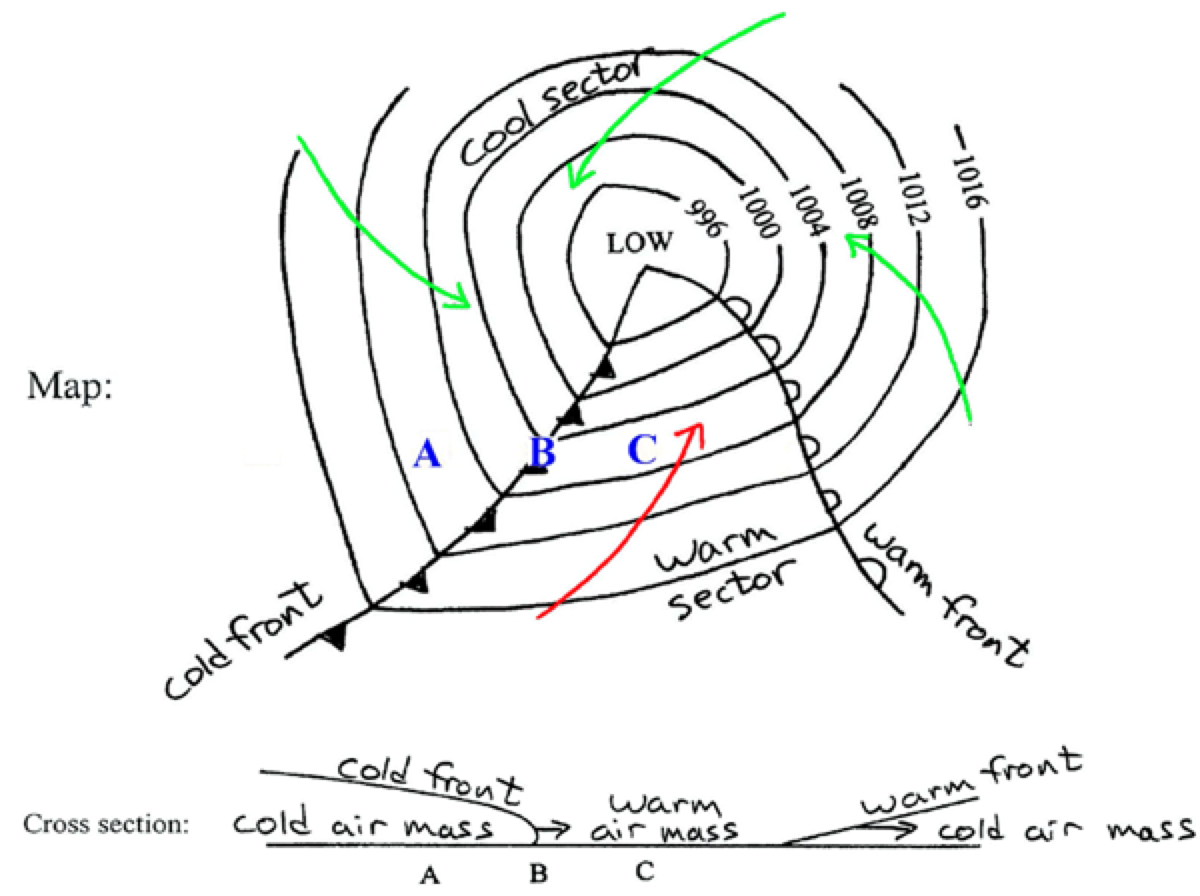
D.This is a anticyclone for northern hemisphere.
\( \frac{\text { cold front }}{\rightarrow} \underset{\text { warm }}{\rightarrow} \underset{\text { mass }}{\text { cold air mass } \rightarrow \text { cold air mass }} \) front A \( \quad \) B \( \quad \) c
Expert Answer
Hi Dear student, Here is the exact answer to your question.i hope you will like it. And also I request you to have a up vote on th