Home /
Expert Answers /
Physics /
the-figure-below-is-a-pv-diagram-for-an-ideal-gas-process-ii-occurs-at-constant-temperature-in-pr-pa457
(Solved): The figure below is a PV diagram for an ideal gas. Process II occurs at constant temperature. In pr ...
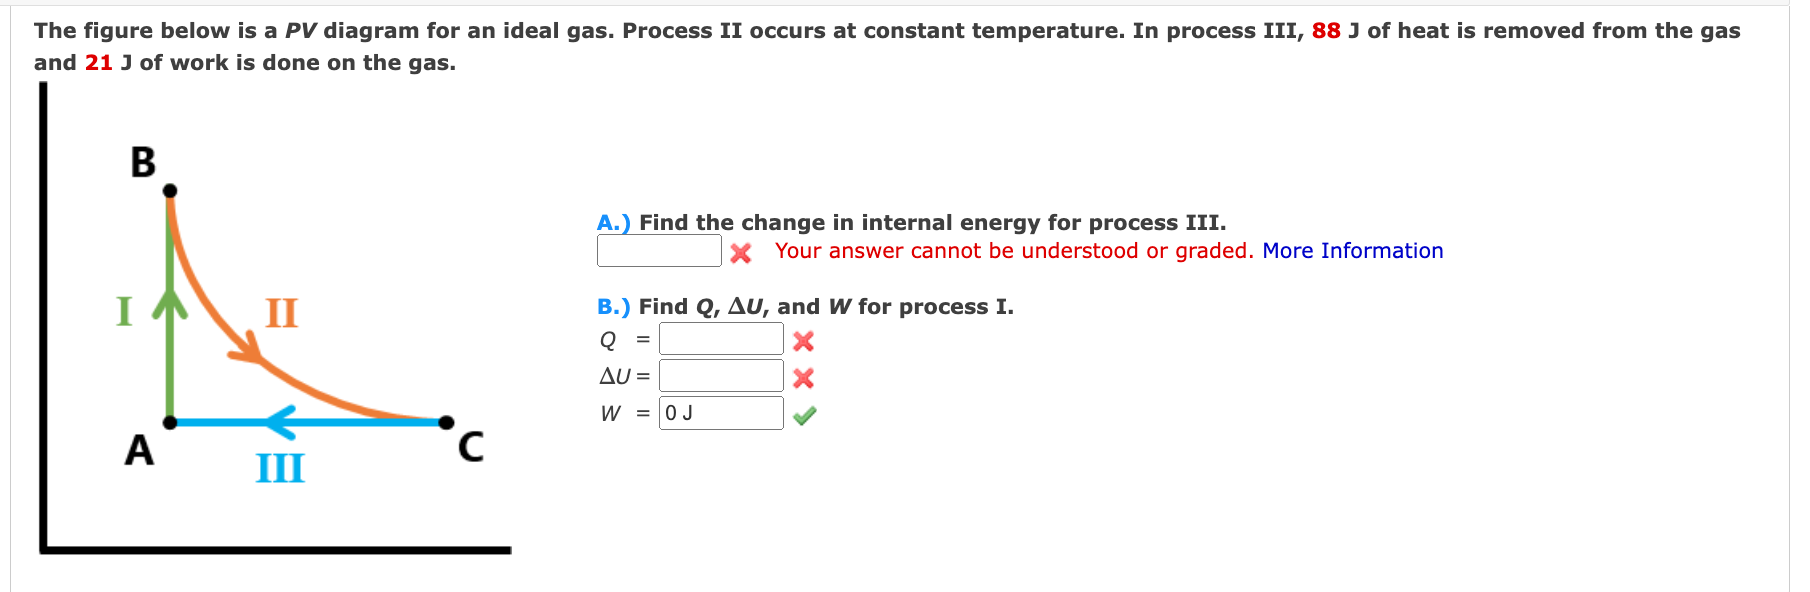
The figure below is a PV diagram for an ideal gas. Process II occurs at constant temperature. In process III,
88Jof heat is removed from the gas and
21Jof work is done on the gas. A.) Find the change in internal energy for process III. Your answer cannot be understood or graded. More Information B.) Find
Q,\Delta U, and
Wfor process
I.
Q=
\Delta U=?
W=