Home /
Expert Answers /
Earth Sciences /
the-figure-below-illustrates-an-energy-level-diagram-for-hydrogen-with-several-pa823
(Solved): The figure below illustrates an energy level diagram for hydrogen, with several ...
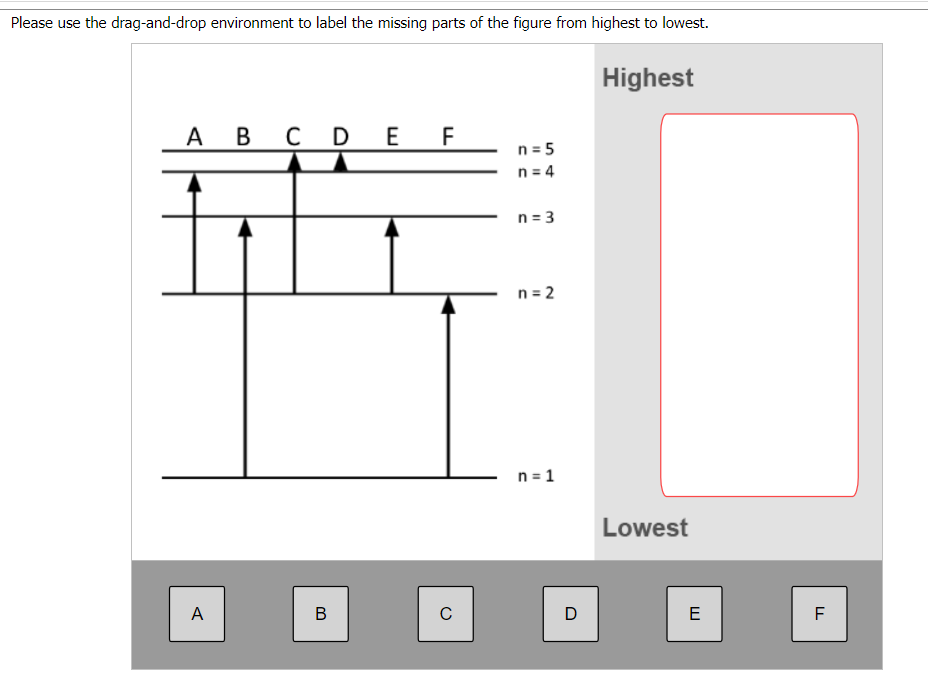
Please use the drag-and-drop environment to label the missing parts of the figure from highest to lowest. Highest
Expert Answer
In this figure, we have an energy level diagram for hydrogen with several electron transitions indicated by arrows. We have to arrange the letters ind