Home /
Expert Answers /
Economics /
the-diagram-illustrates-the-supply-demand-conditions-in-the-market-for-sqeeges-the-equilibrium-pa333
(Solved): The diagram illustrates the supply \& demand conditions in the market for sqeeges. The equilibrium ...

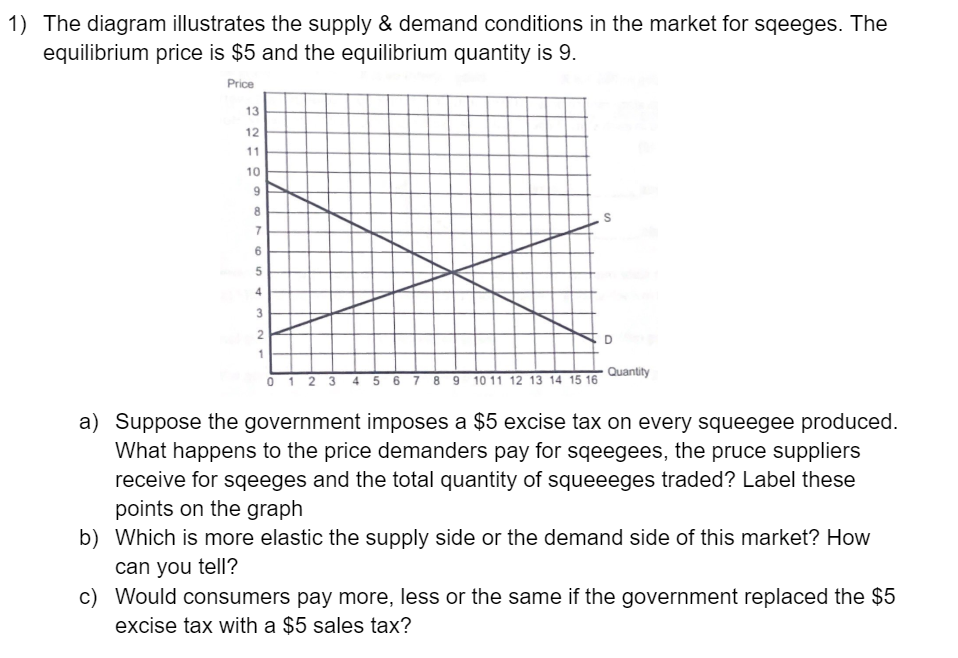
The diagram illustrates the supply \& demand conditions in the market for sqeeges. The equilibrium price is and the equilibrium quantity is 9 . a) Suppose the government imposes a excise tax on every squeegee produced. What happens to the price demanders pay for sqeegees, the pruce suppliers receive for sqeeges and the total quantity of squeeeges traded? Label these points on the graph b) Which is more elastic the supply side or the demand side of this market? How can you tell? c) Would consumers pay more, less or the same if the government replaced the excise tax with a sales tax?