Home /
Expert Answers /
Biology /
the-diagram-below-represents-the-trophic-relationships-in-a-simple-old-field-community-the-ar-pa547
(Solved): The diagram below represents the trophic relationships in a simple old field community. The ar ...
The diagram below represents the trophic relationships in a simple “old field” community. The arrows indicate the flow of energy in the community, and the width of the arrows represents the strength of the interaction. For example, the strength of the interaction between Species A and Species B is twice as strong as the interaction between Species A and Species C.
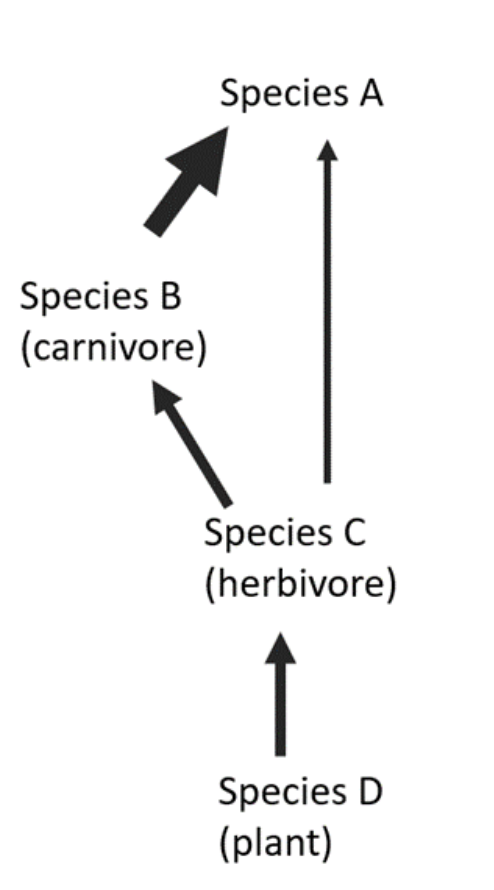
Under the trophic cascades model, removing Species A is predicted to have:
i. A positive direct effect on Species C
ii. A positive direct effect on Species B
iii. A positive indirect effect on Species D
iv. A negative indirect effect on Species D
1. ii, iii
2. i, ii
3. i, ii, iv
4. i, ii, iii
Species B (carnivore) Species A Species C (herbivore) Species D (plant)