Home /
Expert Answers /
Statistics and Probability /
the-data-in-the-table-to-the-right-represent-the-calories-and-sugar-in-grams-in-one-serving-of-se-pa258
(Solved): The data in the table to the right represent the calories and sugar (in grams) in one serving of se ...
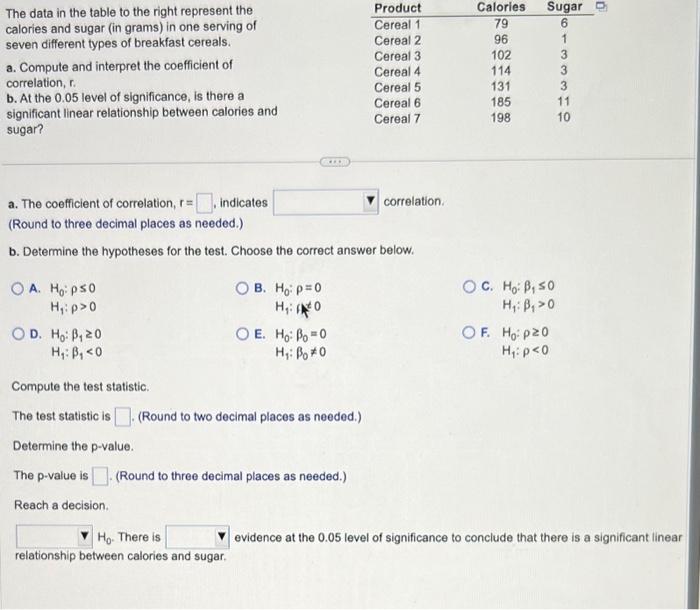
The data in the table to the right represent the calories and sugar (in grams) in one serving of seven different types of breakfast cereals. a. Compute and interpret the coefficient of correlation, r. b. At the \( 0.05 \) level of significance, is there a significant linear relationship between calories and sugar? a. The coefficient of correlation, \( r= \) indicates correlation. (Round to three decimal places as needed.) b. Determine the hypotheses for the test. Choose the correct answer below. A. \( H_{0}: \rho \leq 0 \) \( H_{1}: \rho>0 \) B. \( H_{0}: \rho=0 \) C. \( H_{0}: \beta_{1} \leq 0 \) \( H_{1}: \beta_{1}>0 \) D. \( H_{0}: \beta_{1} \geq 0 \) \( H_{1}: \rho e^{t 0} \) F. \( H_{0}: \rho \geq 0 \) \( H_{1}: \beta_{1}<0 \) E. \( H_{0}: \beta_{0}=0 \) \( H_{1}: \beta_{0} \neq 0 \) \( H_{1}: \rho<0 \)
Expert Answer
(a) The coefficient of correlation, r = 0.7985919 ? 0.799 It indicates positive correlation. (b) The hypotheses for the test are B.H0:?=0H1:??0 The te