Home /
Expert Answers /
Statistics and Probability /
the-consumer-reports-restaurant-customer-satisfaction-survey-is-based-upon-148-599-visits-to-full-pa598
(Solved): The Consumer Reports Restaurant Customer Satisfaction Survey is based upon 148,599 visits to full- ...
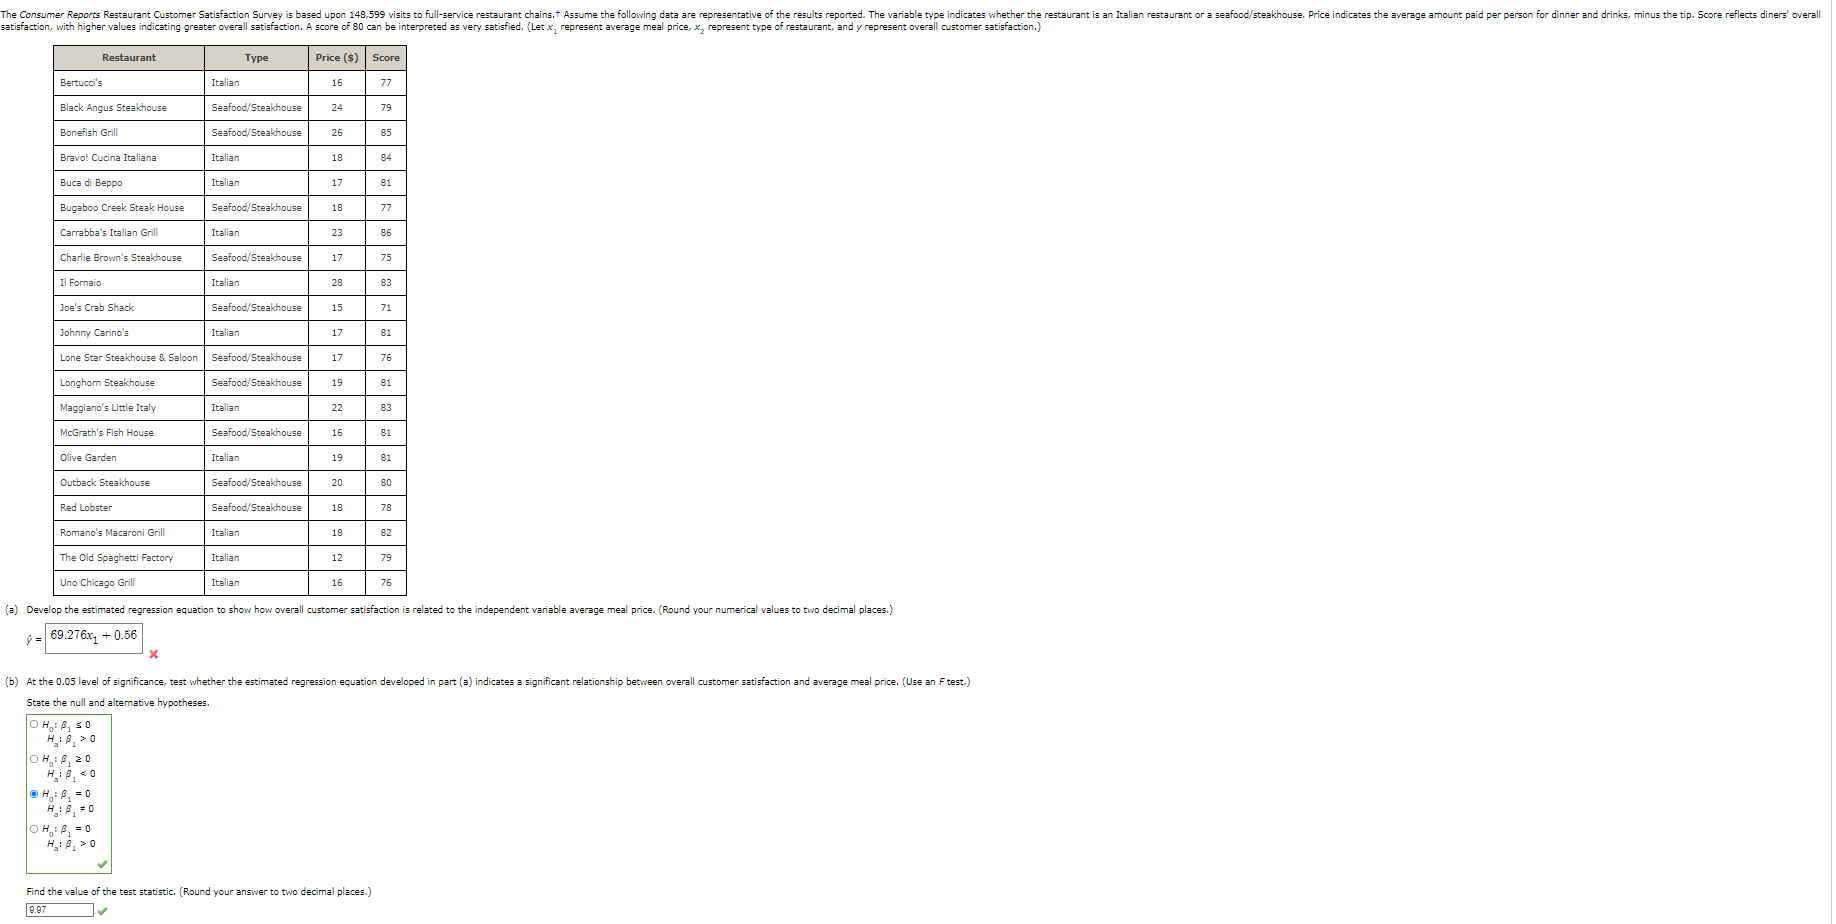
The Consumer Reports Restaurant Customer Satisfaction Survey is based upon 148,599 visits to full-service restaurant chains. Assume the following data are representative of the results reported. The variable type indicates whether the restaurant is an Italian restaurant or a seafood/steakhouse. Price indicates the average amount paid per person for dinner and drinks, minus the tip. Score reflects diners' overall satisfaction, with higher values indicating greater overall satisfaction. A score of 80 can be interpreted as very satisfied. (Let x, represent average meal price, x, represent type of restaurant, and y represent overall customer satisfaction.) Restaurant Type Price ($) Score Bertucci's Italian 16 77 Seafood/Steakhouse 24 79 Black Angus Steakhouse Bonefish Grill Seafood/Steakhouse 26 85 Italian 18. 84 Bravo! Cucina Italiana Buca di Beppo Italian 17 81 Bugaboo Creek Steak House Seafood/Steakhouse 18. 77 Carrabba's Italian Grill Italian 23 86 Charlie Brown's Steakhouse 17 75 Il Fornaio Seafood/Steakhouse Italian Seafood/Steakhouse 28 83 15 71 Joe's Crab Shack Johnny Carino's Italian 17 81 17 76 19 81 22 Seafood/Steakhouse Seafood/Steakhouse Italian Seafood/Steakhouse Italian Seafood/Steakhouse Seafood/Steakhouse 16 Lone Star Steakhouse & Saloon Longhorn Steakhouse Maggiano's Little Italy McGrath's Fish House Olive Garden Outback Steakhouse Red Lobster Romano's Macaroni Grill The Old Spaghetti Factory 81 19 81 20 80 18. 78 Italian 18 82 Italian 12 79 Uno Chicago Grill Italian 16 76 (a) Develop the estimated regression equation to show how overall customer satisfaction is related to the independent variable average meal price. (Round your numerical values to two decimal places.) ý = 69.276xq + 0.56 X (b) At the 0.05 level of significance, test whether the estimated regression equation developed in part (a) indicates a significant relationship between overall customer satisfaction and average meal price. (Use an F test.) State the null and alternative hypotheses. OH: B, 30 H:A? > 0 OH:8, 20 H:P <0 ?H: B? = 0 OHB? = 0 H?: A? > 0 Find the value of the test statistic. (Round your answer to two decimal places.) 9.97 ?
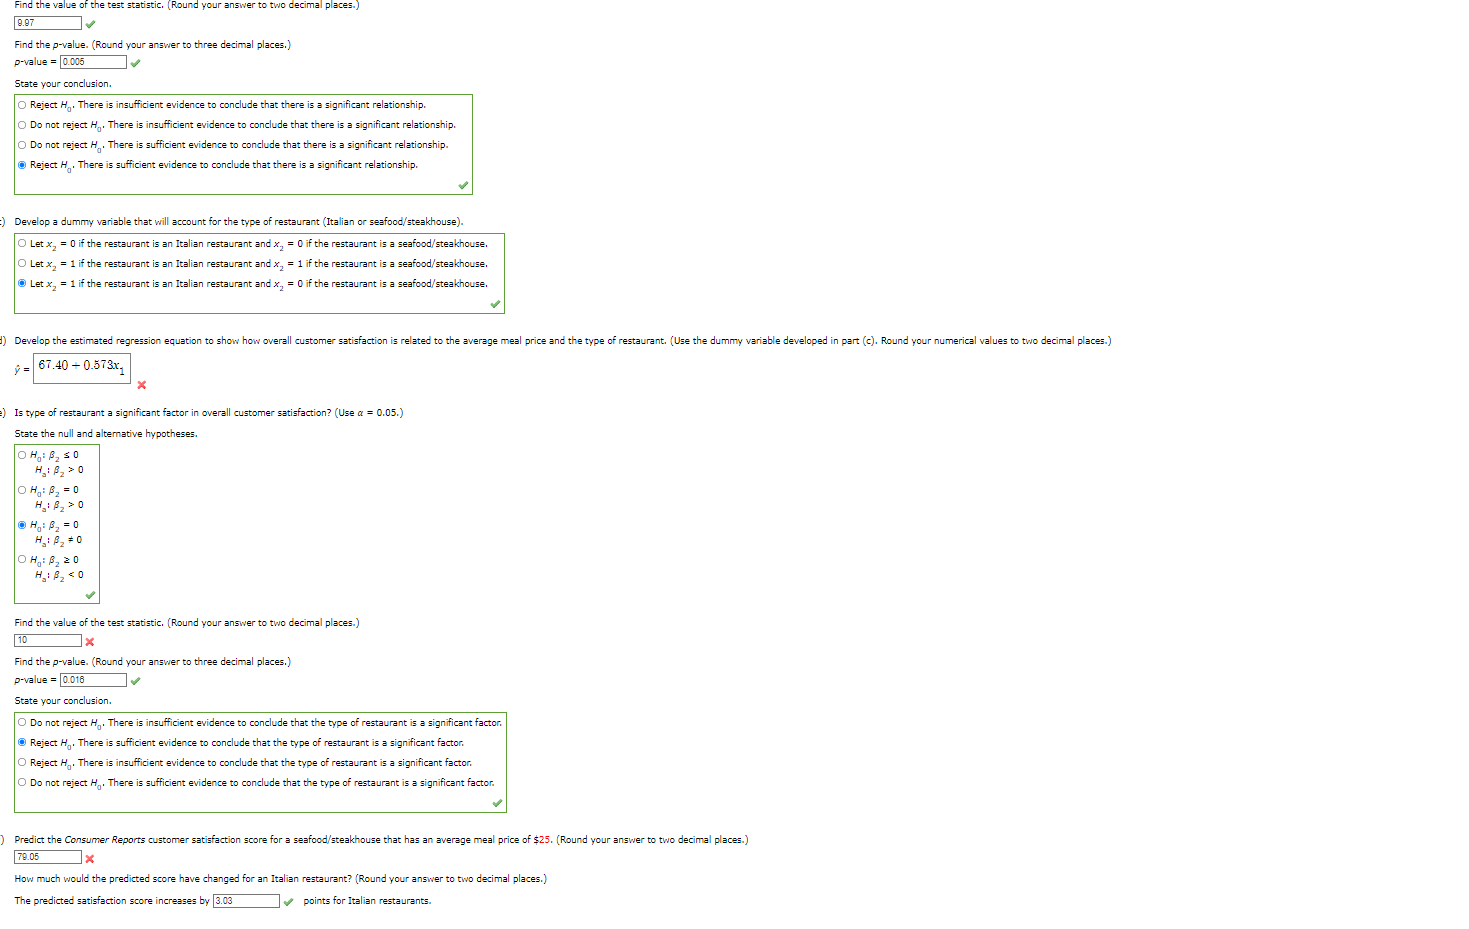
Find the value of the test statistic. (Round your answer to two decimal places.) 9.97 |? Find the p-value. (Round your answer to three decimal places.) p-value=0.005 ? State your conclusion. O Reject H. There is insufficient evidence to conclude that there is a significant relationship. O Do not reject H. There is insufficient evidence to conclude that there is a significant relationship. O Do not reject H. There is sufficient evidence to conclude that there is a significant relationship. Reject H. There is sufficient evidence to conclude that there is a significant relationship. :) Develop a dummy variable that will account for the type of restaurant (Italian or seafood/steakhouse). O Let x? = 0 if the restaurant is an Italian restaurant and x? = 0 if the restaurant is a seafood/steakhouse. O Let x? = 1 if the restaurant is an Italian restaurant and x? = 1 if the restaurant is a seafood/steakhouse. ?Let x? = 1 if the restaurant is an Italian restaurant and x? = 0 if the restaurant is a seafood/steakhouse. d) Develop the estimated regression equation to show how overall customer satisfaction is related to the average meal price and the type of restaurant. (Use the dummy variable developed in part (c). Round your numerical values to two decimal places.) ? = 67.40 + 0.573x? X e) Is type of restaurant a significant factor in overall customer satisfaction? (Use a = 0.05.) State the null and alternative hypotheses. OH: B? ?0 H?: A? > 0 |OH?²B? = 0 H.?: B? > 0 ?H??: B? = 0 H?: B? #0 OH: B? 20 H?: B? <0 Find the value of the test statistic. (Round your answer to two decimal places.) 10 x Find the p-value. (Round your answer to three decimal places.) p-value = 0.016 State your conclusion. O Do not reject H. There is insufficient evidence to conclude that the type of restaurant is a significant factor. ? Reject H. There is sufficient evidence to conclude that the type of restaurant is a significant factor. O Reject H. There is insufficient evidence to conclude that the type of restaurant is a significant factor. O Do not reject H. There is sufficient evidence to conclude that the type of restaurant is a significant factor. Predict the Consumer Reports customer satisfaction score for a seafood/steakhouse that has an average meal price of $25. (Round your answer to two decimal places.) 79.05 x How much would the predicted score have changed for an Italian restaurant? (Round your answer to two decimal places.) The predicted satisfaction score increases by 3.03 ?points for Italian restaurants.