Home /
Expert Answers /
Statistics and Probability /
the-comparisons-of-scholastic-aptitude-test-sat-scores-based-on-the-highest-level-of-education-a-pa224
(Solved): The comparisons of Scholastic Aptitude Test (SAT) scores based on the highest level of education a ...
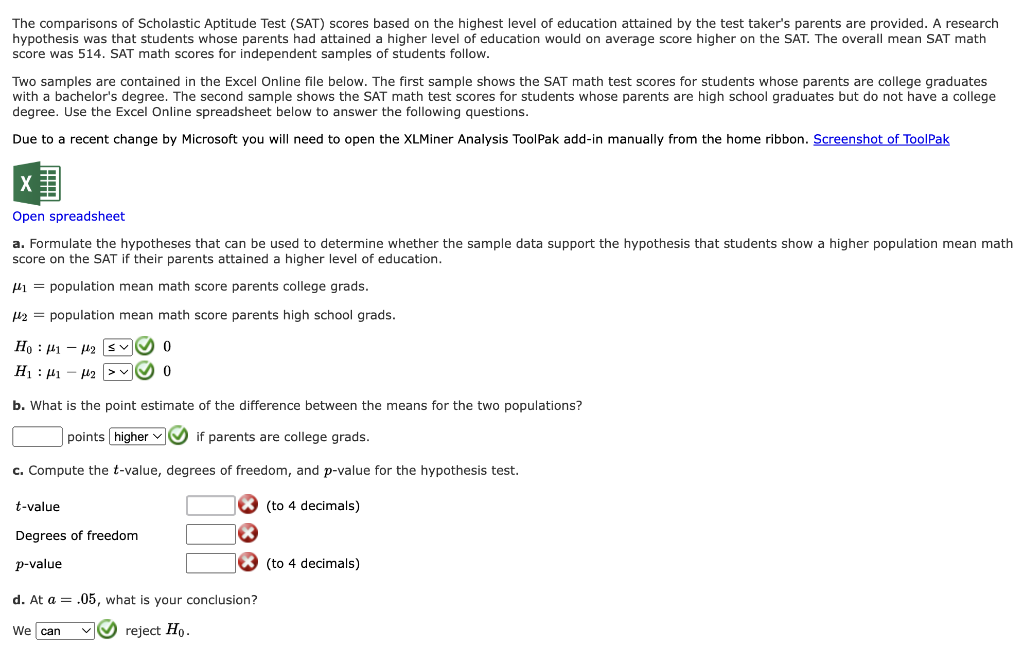
The comparisons of Scholastic Aptitude Test (SAT) scores based on the highest level of education attained by the test taker's parents are provided. A research hypothesis was that students whose parents had attained a higher level of education would on average score higher on the SAT. The overall mean SAT math score was 514. SAT math scores for independent samples of students follow. Two samples are contained in the Excel Online file below. The first sample shows the SAT math test scores for students whose parents are college graduates with a bachelor's degree. The second sample shows the SAT math test scores for students whose parents are high school graduates but do not have a college degree. Use the Excel Online spreadsheet below to answer the following questions. Due to a recent change by Microsoft you will need to open the XLMiner Analysis ToolPak add-in manually from the home ribbon. Open spreadsheet a. Formulate the hypotheses that can be used to determine whether the sample data support the hypothesis that students show a higher population mean math score on the SAT if their parents attained a higher level of education. population mean math score parents college grads. population mean math score parents high school grads. b. What is the point estimate of the difference between the means for the two populations? points if parents are college grads. c. Compute the -value, degrees of freedom, and -value for the hypothesis test. -value (to 4 decimals) Degrees of freedom -value (to 4 decimals) d. At , what is your conclusion? We reject .
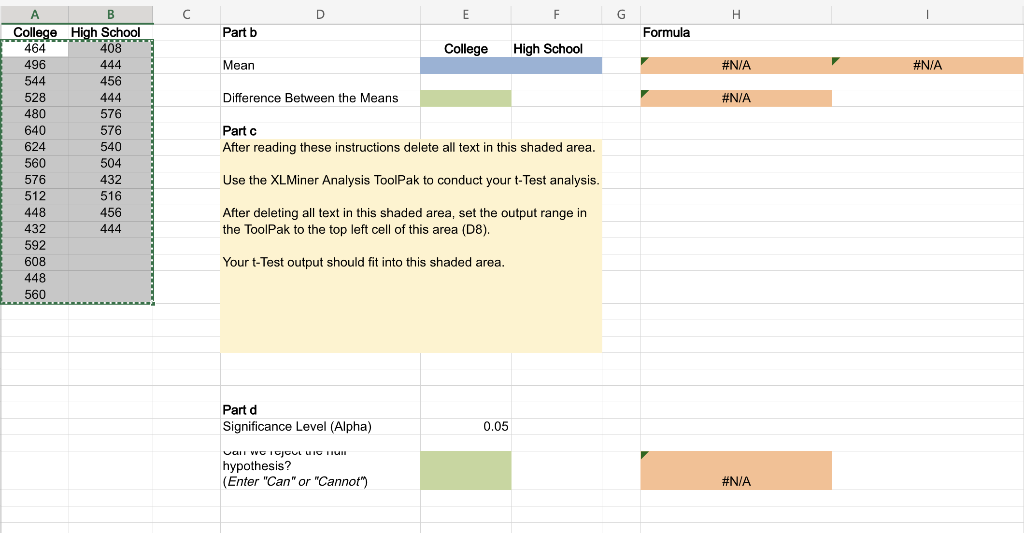
\begin{tabular}{c|c} A & B \\ \hline College & High School \\ \hline 464 & 408 \\ \hline 496 & 444 \\ 544 & 456 \\ 528 & 444 \\ 480 & 576 \\ 640 & 576 \\ 624 & 540 \\ 560 & 504 \\ 576 & 432 \\ 512 & 516 \\ 448 & 456 \\ 432 & 444 \\ 592 & \\ 608 & \\ 448 & \\ 560 & \end{tabular} After reading these instructions delete all text in this shaded area. Use the XLMiner Analysis ToolPak to conduct your t-Test analysis. After deleting all text in this shaded area, set the output range in the ToolPak to the top left cell of this area (D8). Your t-Test output should fit into this shaded area. Part d Significance Level (Alpha) vail vve igjout he Hü hypothesis? (Enter "Can" or "Cannot") \#N/A
Expert Answer
The data that was provided in the question is shown belowCollegeHigh School464408496444544456528444480576640576624540560504576432512516448456432444592