Home
Expert Answers
Place Order
How It Works
About Us
Contact Us
Sign In / Sign Up
Sign In
Sign Up
Home
/
Expert Answers
/
Algebra
/ the-circle-graph-shows-how-a-family-budgets-its-annual-income-if-the-total-annual-income-is-pa264
(Solved): The circle graph shows how a family budgets its annual income. If the total annual income is \( ...
The circle graph shows how a family budgets its annual income. If the total annual income is \( \$ 95,000 \), what amount is budgeted for Food?
We have an Answer from Expert
View Expert Answer
Expert Answer
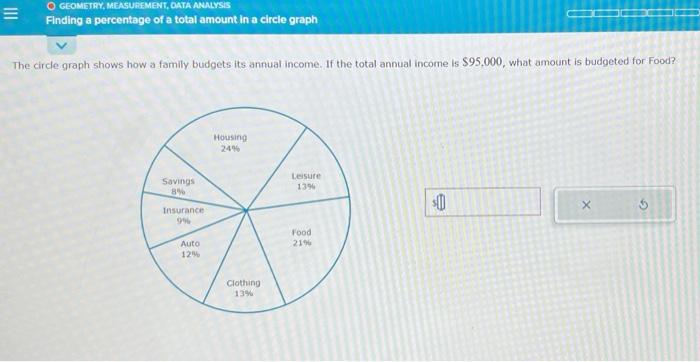
Total annual income = $95,000 Amount budgeted for food = 21% So 21%
We have an Answer from Expert
Buy This Answer $5
Place Order
We Provide Services Across The Globe
Order Now
Go To Answered Questions