(Solved): The block diagram of an aircraft roll control system is shown in Figure Q4.1.Open-loop frequency res ...
The block diagram of an aircraft roll control system is shown in Figure Q4.1.
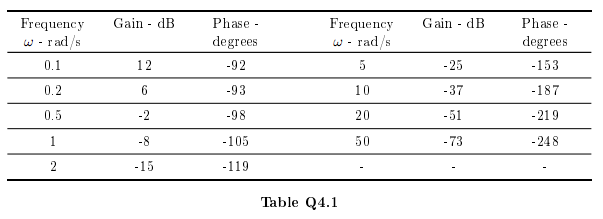
Open-loop frequency response data is shown in Table Q4.1, with a unity gain, k = 1.
(a) A steady-state specification requires a particular steady-state error in response to a unit ramp input. A gain adjustment k = 12.5 is proposed. Use the final value theorem to find the resulting steady-state error, and give the corresponding dB gain value for the gain parameter. [5 Marks]
(b) Plot the data of Table Q4.1 on Figure Q4.2 (on page 7) to produce a Bode diagram. Adjust this diagram to illustrate the effect of the choice of k from part (a). Hint: It does not matter if the lower-frequency points are shifted of the graph, estimate their locations. [5 Marks]
(c) Estimate the gain margin, the phase margin, and the corresponding cross over frequencies that result from the gain adjustment in part (b). [5 Marks]
(d) Determine the value of the variable gain k that results in a phase margin of 70degrees, and state the corresponding gain crossover frequency. Annotate Figure Q4.2 as appropriate. Use the phase margin to predict the percentage overshoot that would be achieved with this design. [10 Marks]

