Home /
Expert Answers /
Statistics and Probability /
the-accompanying-table-shows-a-portion-of-quarterly-revenues-in-mil-pa932
(Solved): The accompanying table shows a portion of quarterly revenues (in \( \$ \) mil ...
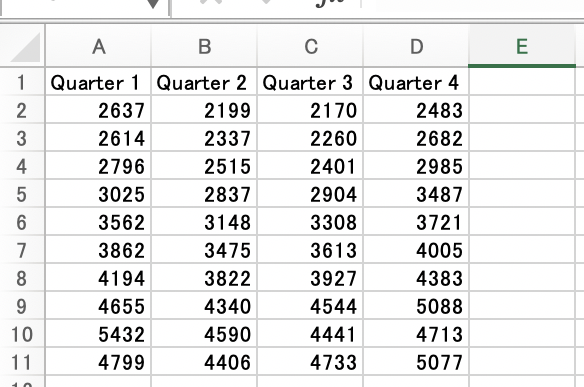
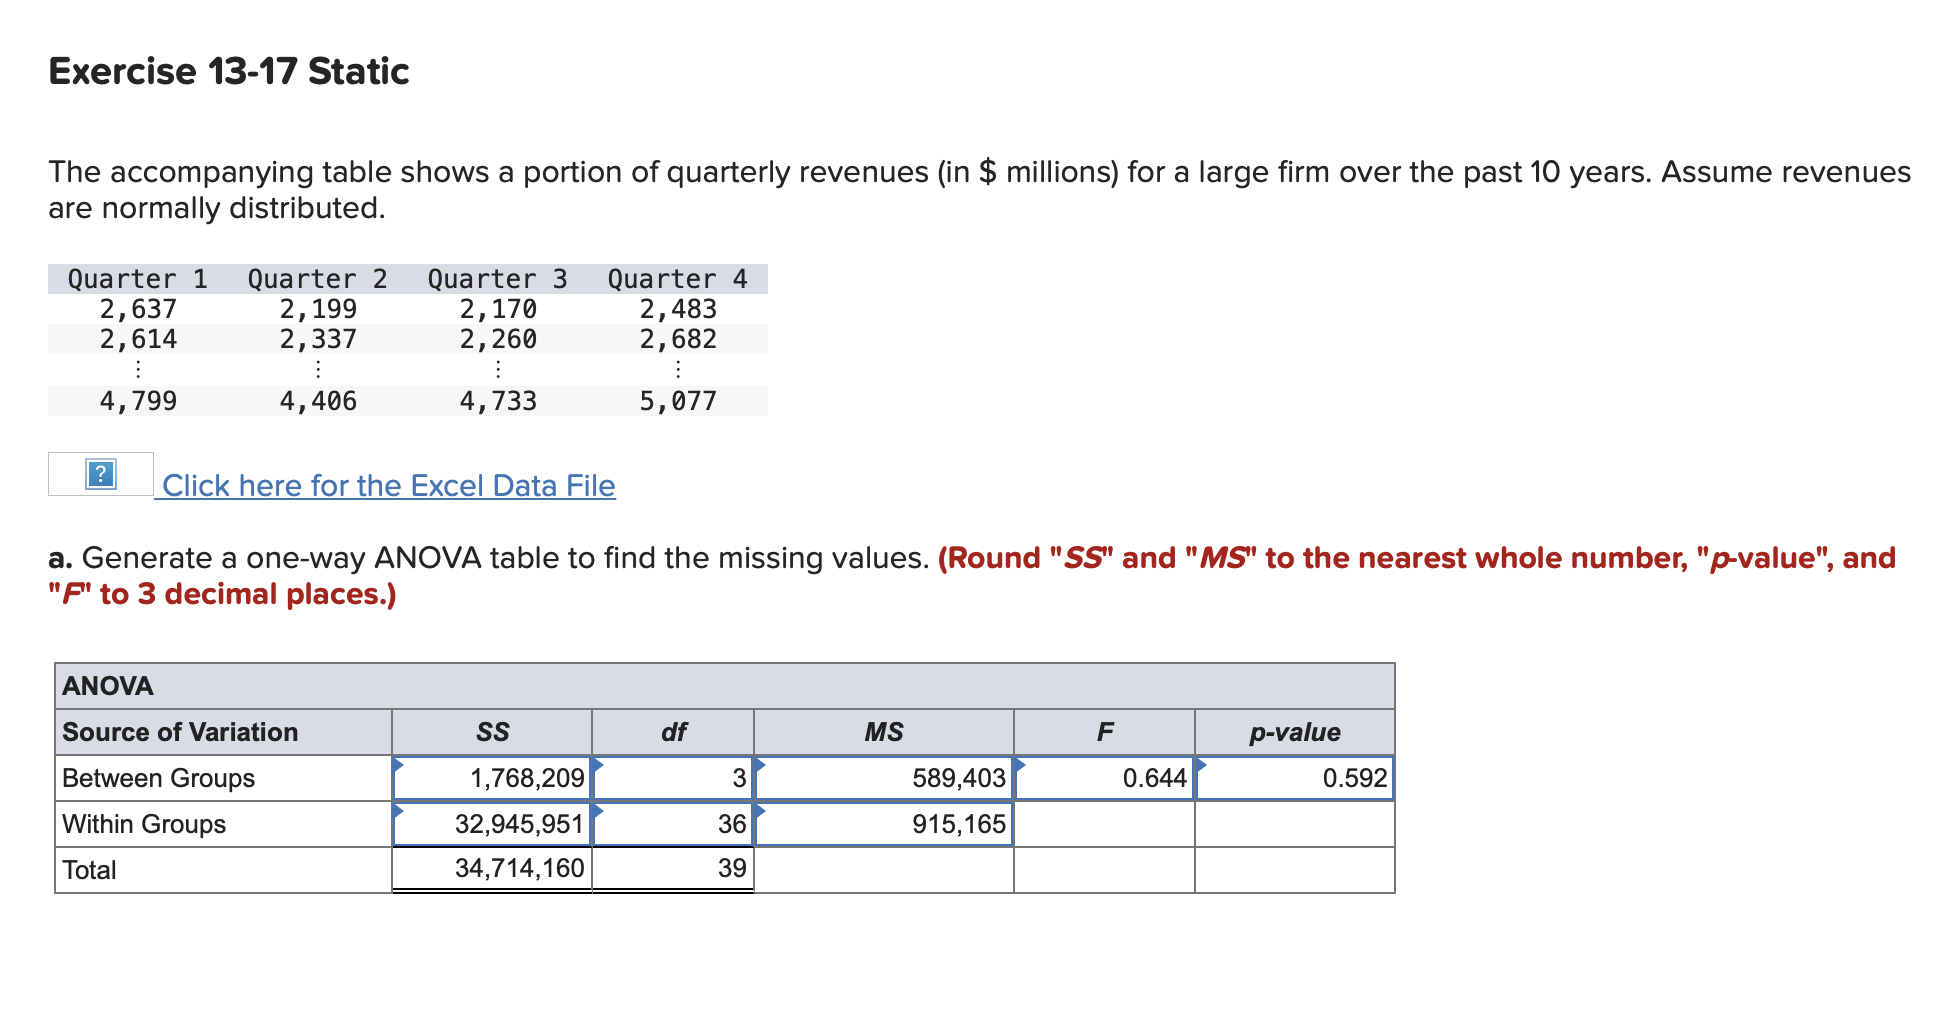
The accompanying table shows a portion of quarterly revenues (in \( \$ \) millions) for a large firm over the past 10 years. Assume revenues are normally distributed. Click here for the Excel Data File a. Generate a one-way ANOVA table to find the missing values. (Round "SS" and "MS" to the nearest whole number, "p-value", and "F" to 3 decimal places.)
\begin{tabular}{|c|r|r|r|r|r|} \hline \hline & \multicolumn{1}{|c|}{ A } & \multicolumn{1}{c|}{ B } & \multicolumn{1}{c|}{ C } & \multicolumn{1}{c|}{ D } & \multicolumn{1}{|c|}{\( \mathrm{E} \)} \\ \hline 1 & Quarter 1 & Quarter 2 & Quarter 3 & Quarter 4 & \\ \hline 2 & 2637 & 2199 & 2170 & 2483 & \\ \hline 3 & 2614 & 2337 & 2260 & 2682 & \\ \hline 4 & 2796 & 2515 & 2401 & 2985 & \\ \hline 5 & 3025 & 2837 & 2904 & 3487 & \\ \hline 6 & 3562 & 3148 & 3308 & 3721 & \\ \hline 7 & 3862 & 3475 & 3613 & 4005 & \\ \hline 8 & 4194 & 3822 & 3927 & 4383 & \\ \hline 9 & 4655 & 4340 & 4544 & 5088 & \\ \hline 10 & 5432 & 4590 & 4441 & 4713 & \\ \hline 11 & 4799 & 4406 & 4733 & 5077 & \\ \hline \end{tabular}
Expert Answer
The data that was provided in the question is shown below Quarter 1 Quarter 2 Quarter 3 Quarter 4 2637 2199 2170 2483 2614 2337 2260 2682 2796 2515 24