Home /
Expert Answers /
Economics /
the-accompanying-diagram-represents-the-market-for-violins-suppose-that-a-new-technology-allows-be-pa840
(Solved): The accompanying diagram represents the market for violins. Suppose that a new technology allows be ...
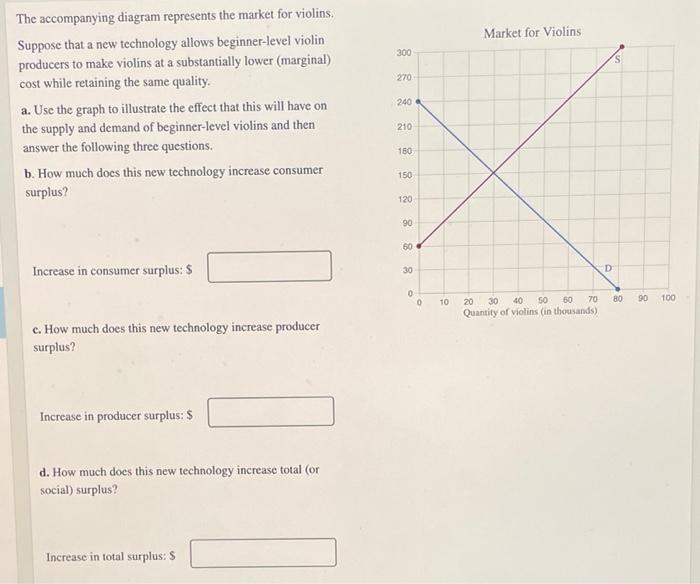
The accompanying diagram represents the market for violins. Suppose that a new technology allows beginner-level violin producers to make violins at a substantially lower (marginal) cost while retaining the same quality. a. Use the graph to illustrate the effect that this will have on the supply and demand of beginner-level violins and then answer the following three questions. b. How much does this new technology increase consumer surplus? Increase in consumer surplus: S c. How much does this new technology increase producer surplus? Increase in producer surplus: $ d. How much does this new technology increase total (or social) surplus? Increase in total surplus: S 300 270 240 210 160 150 120 90 60 30 0 0 10 Market for Violins 20 30 70 40 50 60 Quantity of violins (in thousands). D 80 90 100