Home /
Expert Answers /
Other Math /
the-accompanying-data-file-contains-10-observations-for-t-and-yt-bapicture-click-here-for-the-pa569
(Solved): The accompanying data file contains 10 observations for t and yt. Bapicture Click here for the ...
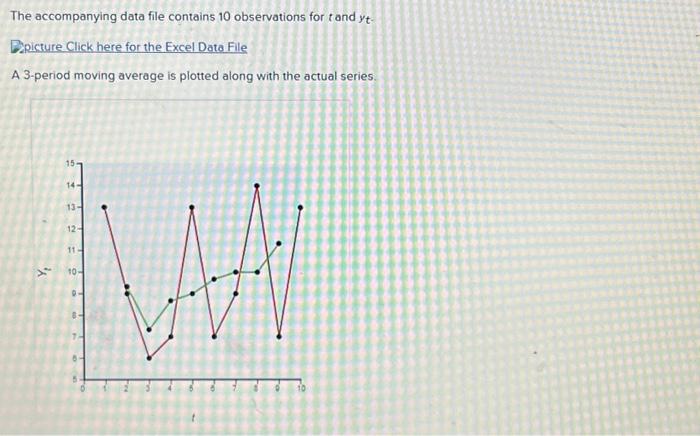
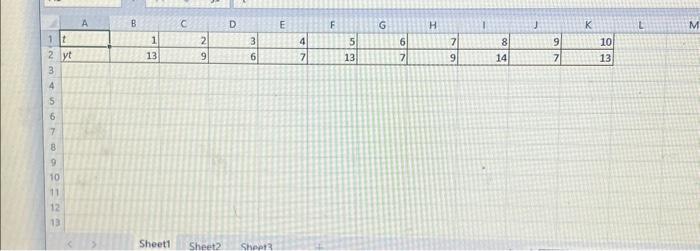
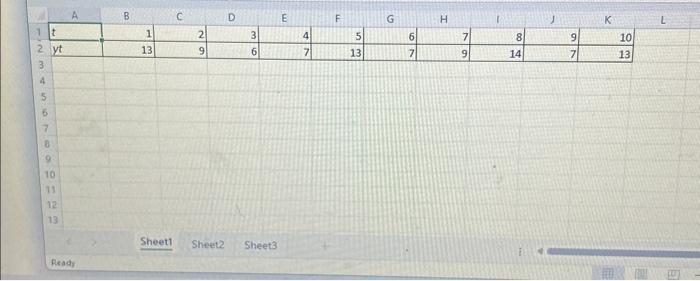
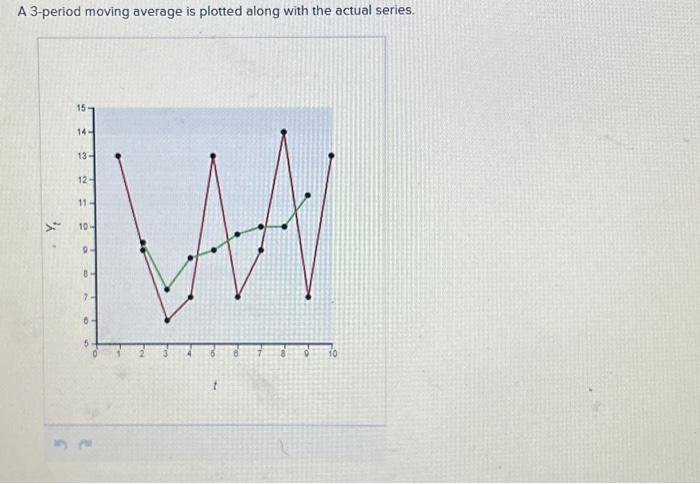
The accompanying data file contains 10 observations for and . Bapicture Click here for the Excel Data File A 3-period moving average is plotted along with the actual series.
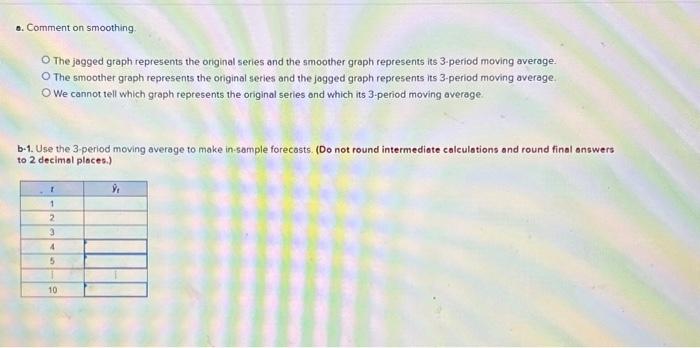
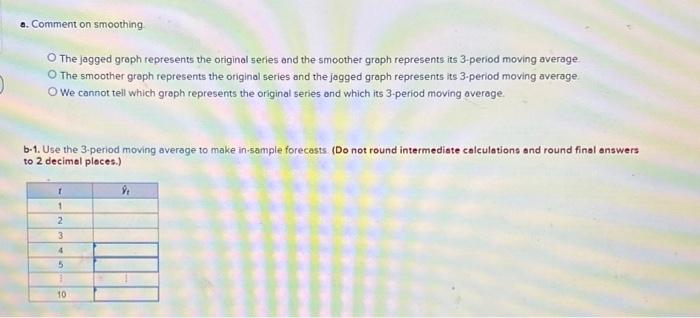
6. Comment on smoothing The jagged graph represents the original series and the smoother graph represents its 3-period moving average. The smoother graph represents the original series and the jogged graph represents its 3-period moving average. We cannot tell which graph represents the original series and which its 3-period moving average. b.1. Use the 3-period moving average to make in-sample forecasts. (Do not round intermediote calculations and round final answers to 2 decimol ploces.)
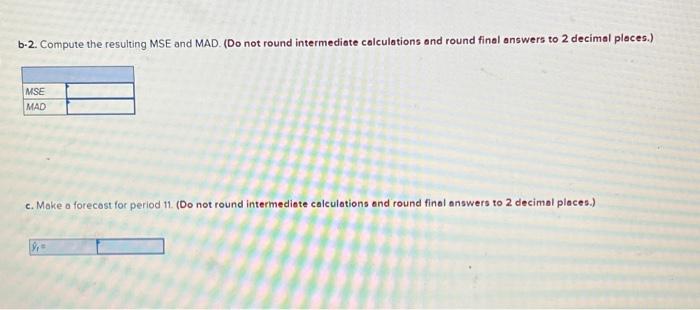
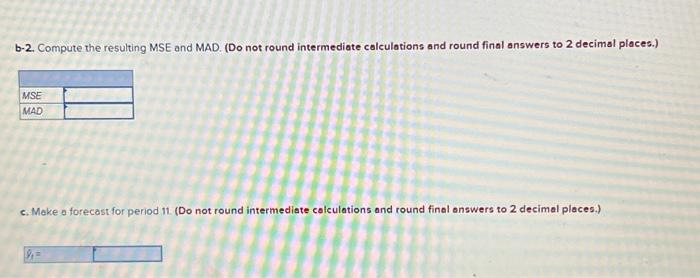
b.2. Compute the resulting MSE and MAD. (Do not round intermediate calculations and round final answers to 2 decimal places.) c. Make a forecost for period 11. (Do not round intermediate calculations and round final answers to 2 decimol places.)
Sheet1 Sheet2 Sheet3
A 3-period moving average is plotted along with the actual series.
a. Comment on smoothing The jagged graph represents the original series and the smoother groph represents its 3-period moving average The smoother graph represents the original series and the jagged graph represents its 3-period moving average We cannot tell which groph represents the original series ond which its 3-period moving overage b-1. Use the 3-period moving average to make in-sample forecasts. (Do not round intermediate calculations and round final answer: to 2 decimal ploces.)
b-2. Compute the resulting MSE and MAD. (Do not round intermediate calculations and round final answers to 2 decimal places.) c. Make a forecast for period 11. (Do not round intermediate colculations and round final onswers to 2 decimal places.)
Expert Answer
Solutiona. From the given graph,The smoother graph represents the original series and the jagged graph represents its 3-period moving average.