Home /
Expert Answers /
Economics /
thank-you-nbsp-3-why-the-aggregate-demand-curve-slopes-downward-the-following-graph-shows-the-agg-pa429
(Solved): Thank you! 3. Why the aggregate demand curve slopes downward The following graph shows the agg ...
Thank you!
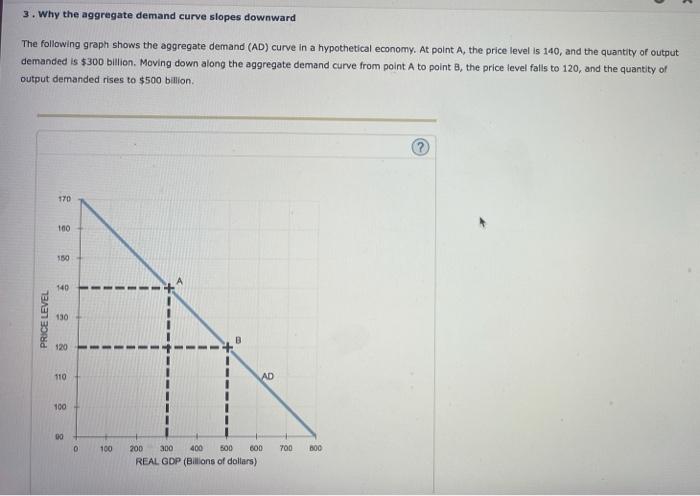

3. Why the aggregate demand curve slopes downward The following graph shows the aggregate demand (AD) curve in a hypothetical economy. At point A, the price level is 140 , and the quantity of output demanded is \( \$ 300 \) billion. Moving down along the aggregate demand curve from point \( \mathrm{A} \) to point \( \mathrm{B} \), the price level falls to 120 , and the quantity of output demanded rises to \( \$ 500 \) billion.
As the price level falls, the cost of borrowing money will , causing the quantity of output demanded to This phenomenon is known as the effect. When an economy's price level falis, ceteris paribus, the domestic price. level relative to the price ievel in other countries winl This means that. domestic exports will be relatively expensive than before, while foreign imports will be relatively number of domestic products purchased by foreigners (exports) will therefore and the number of foreign products purchased by domestic consumers and firms (imports) will Net exports will therefore domestic output demanded to This phenomenon is known as the effecti causing the quantity of
Expert Answer
Demand A concept in economics that deals with a consumer's desire and willingness to pay for a certain commodity or service at a particular cost. Acco