Home /
Expert Answers /
Algebra /
table-of-values-scatter-plots-nbsp-the-table-shows-the-approximate-number-of-people-that-attended-a-pa205
(Solved): table of values scatter plots the table shows the approximate number of people that attended a ...
table of values scatter plots
need help with 2, 3 4 please
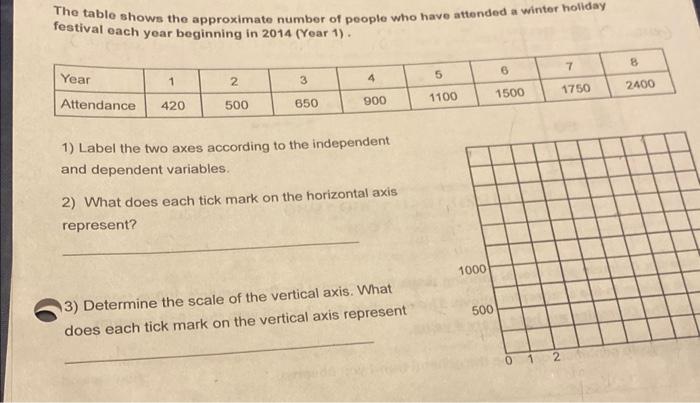
The table shows the approximate number of people who have attended a winter hollday festival each yoar beginning in 2014 (Year 1). 1) Label the two axes according to the independent and dependent variables. 2) What does each tick mark on the horizontal axis represent? 3) Determine the scale of the vertical axis. What does each tick mark on the vertical axis represent
Expert Answer
Given a table that shows the approximate number of people who have attended a winter holiday festival each year. 1) Label the two axes according the i