Home /
Expert Answers /
Statistics and Probability /
suppose-the-table-below-contains-the-median-household-income-for-a-family-with-two-earners-for-eac-pa434
(Solved): Suppose the table below contains the median household income for a family with two earners for eac ...
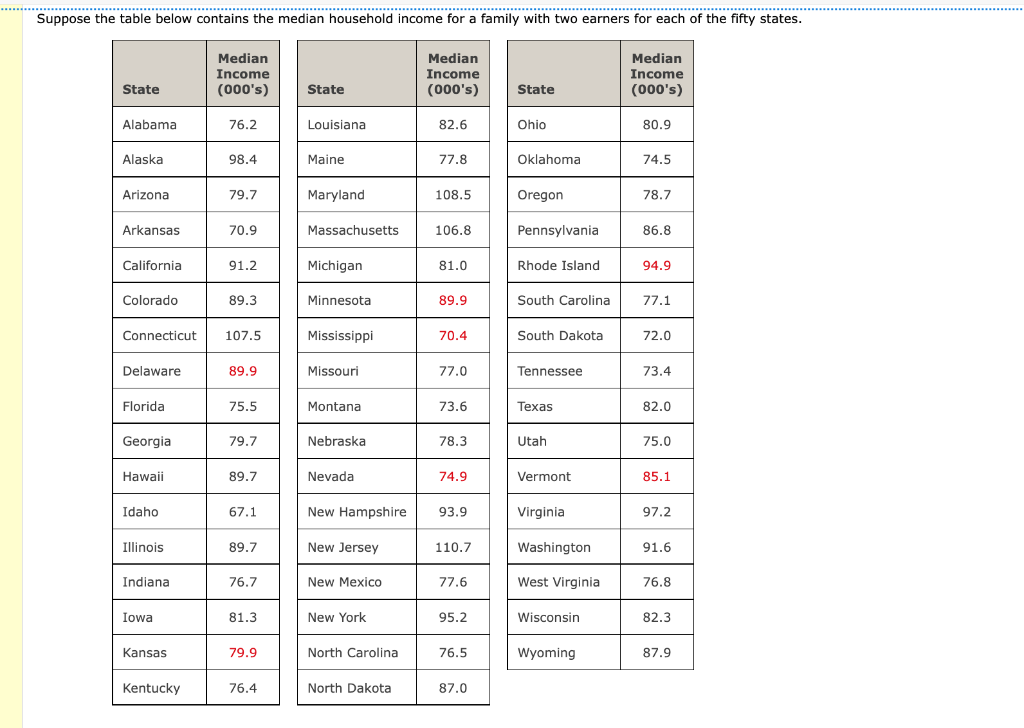
Suppose the table below contains the median household income for a family with two earners for each of the fifty states. \begin{tabular}{|l|c|} \hline State & Median Income (000's) \\ \hline Alabama & \( 76.2 \) \\ \hline Alaska & \( 98.4 \) \\ \hline Arizona & \( 79.7 \) \\ \hline Arkansas & \( 70.9 \) \\ \hline California & \( 91.2 \) \\ \hline Colorado & \( 89.3 \) \\ \hline Connecticut & \( 107.5 \) \\ \hline Delaware & \( 89.9 \) \\ \hline Florida & \( 75.5 \) \\ \hline Georgia & \( 79.7 \) \\ \hline Hawaii & \( 89.7 \) \\ \hline Indinois & \( 89.7 \) \\ \hline \end{tabular} \begin{tabular}{|l|c|} \hline State & Median Income (000's) \\ \hline Louisiana & \( 82.6 \) \\ \hline Maine & \( 77.8 \) \\ \hline Maryland & \( 108.5 \) \\ \hline Massachusetts & \( 106.8 \) \\ \hline Michigan & \( 81.0 \) \\ \hline Minnesota & \( 89.9 \) \\ \hline Mississippi & \( 70.4 \) \\ \hline Missouri & \( 77.0 \) \\ \hline Montana & \( 73.6 \) \\ \hline Nebraska & \( 78.3 \) \\ \hline Nevada & \( 74.9 \) \\ \hline New Hampshire & \( 93.9 \) \\ \hline New Jersey & \( 110.7 \) \\ \hline New Mexico & \( 77.6 \) \\ \hline Nork & \( 95.2 \) \\ \hline \end{tabular}
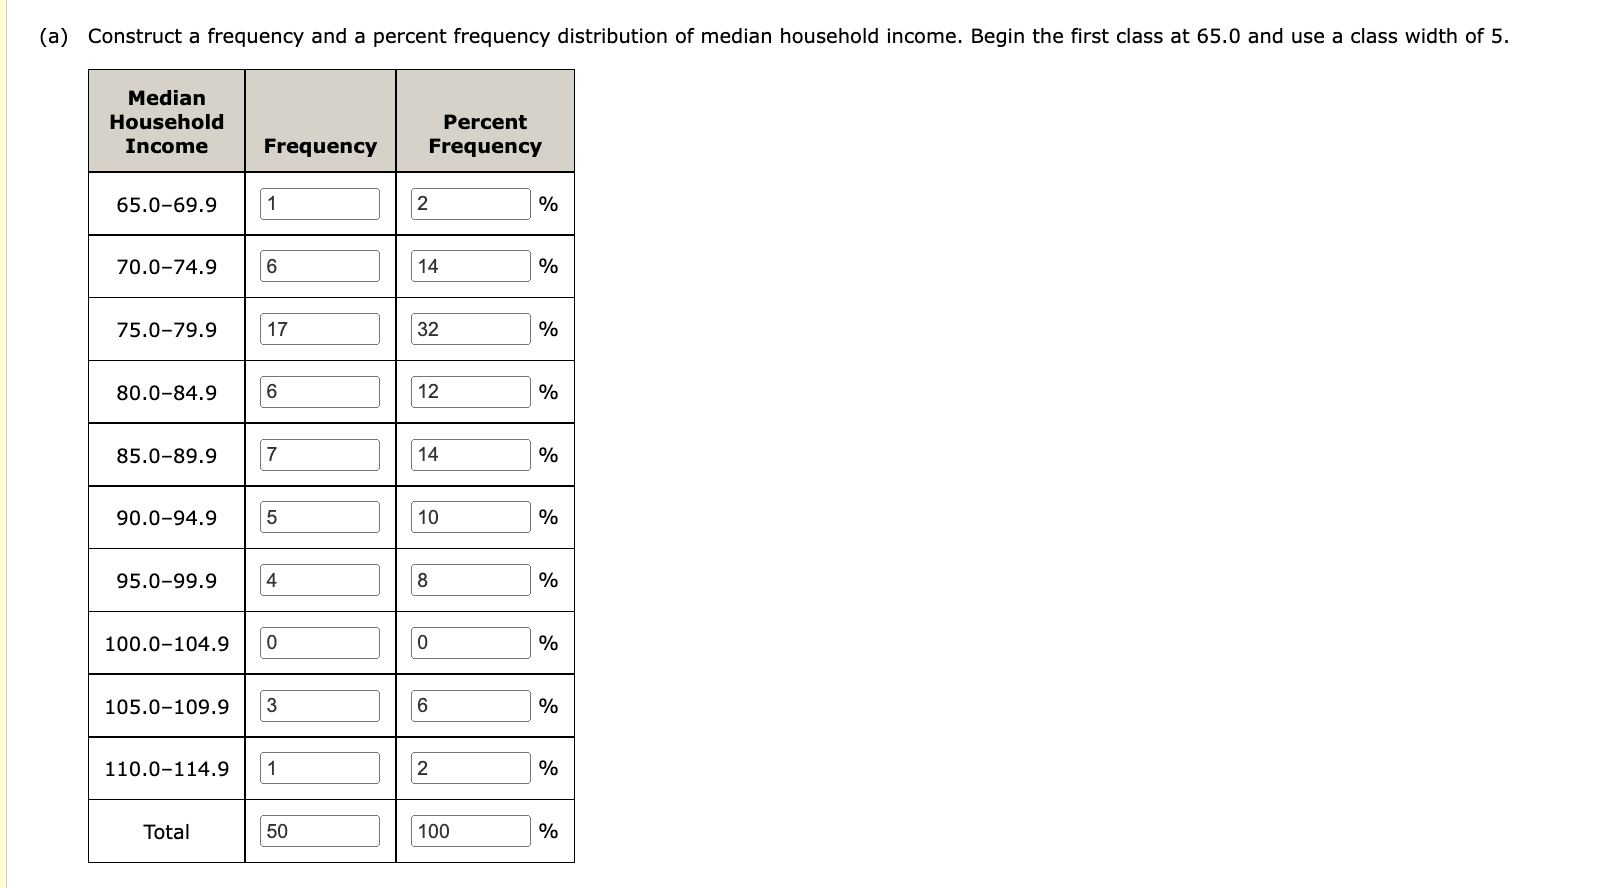
(a) Construct a frequency and a percent frequency distribution of median household income. Begin the first class at \( 65.0 \) and use a class width of \( 5 . \)
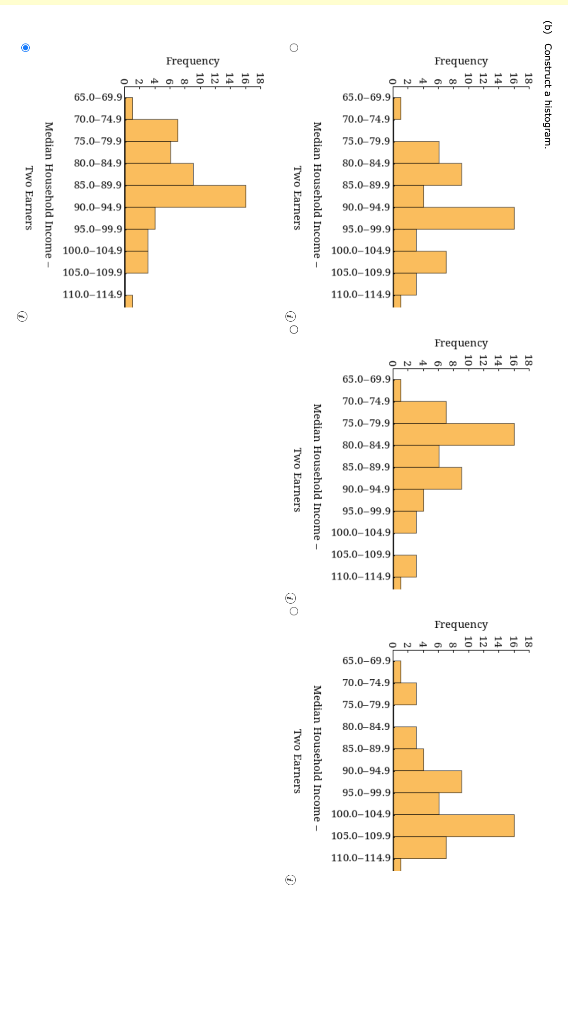
(b) Construct a histogram. Median Household Income - Two Earners (1)
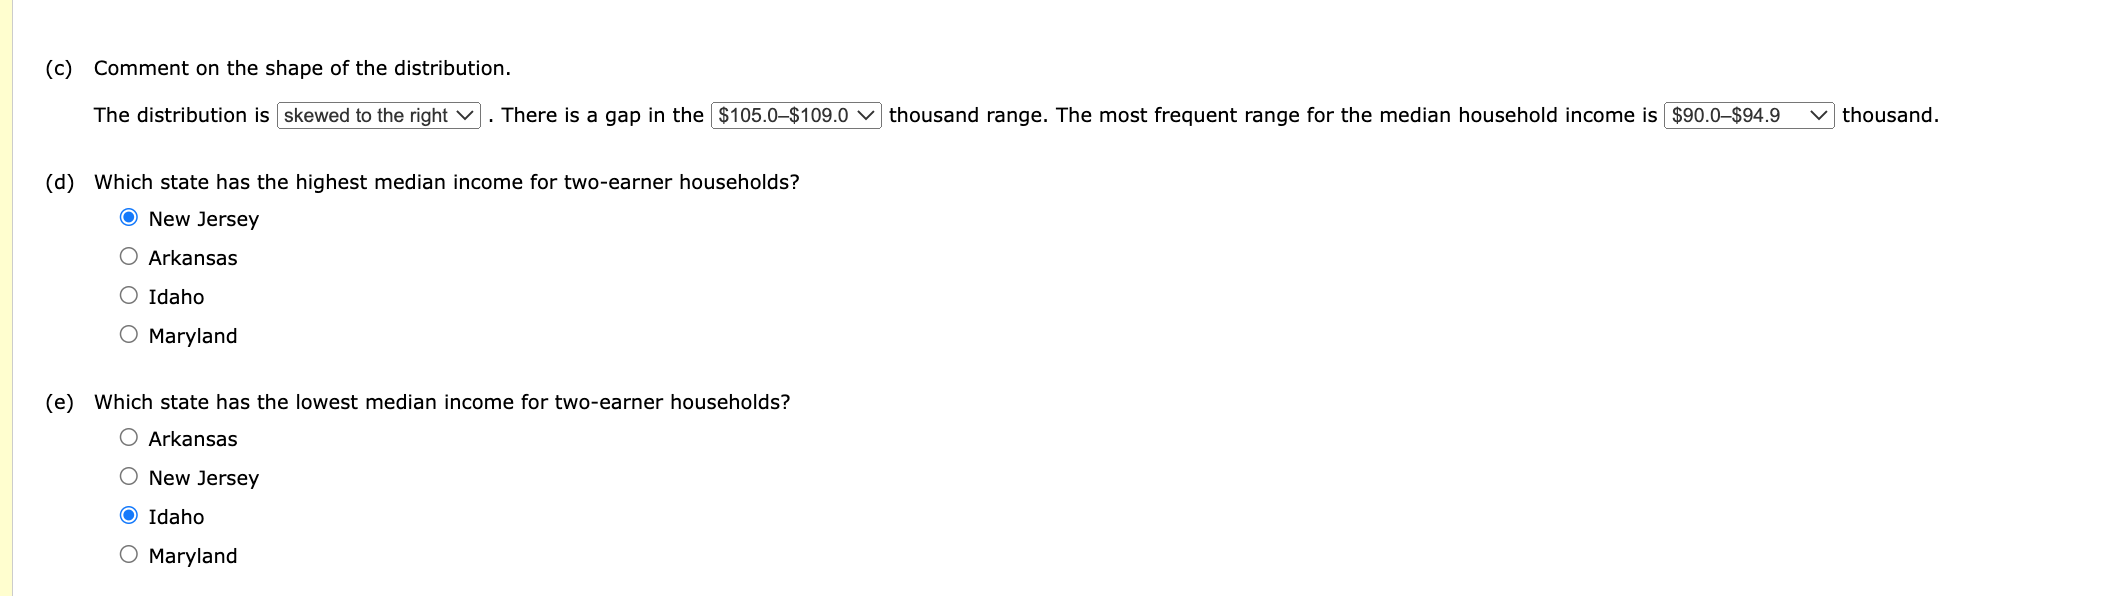
(c) Comment on the shape of the distribution. (d) Which state has the highest median income for two-earner households? New Jersey Arkansas Idaho Maryland (e) Which state has the lowest median income for two-earner households? Arkansas New Jersey Idaho Maryland