Home /
Expert Answers /
Economics /
suppose-that-in-a-recent-market-period-the-relationship-shown-in-the-accompanying-table-and-graph-pa163
(Solved): Suppose that in a recent market period, the relationship shown in the accompanying table and graph ...
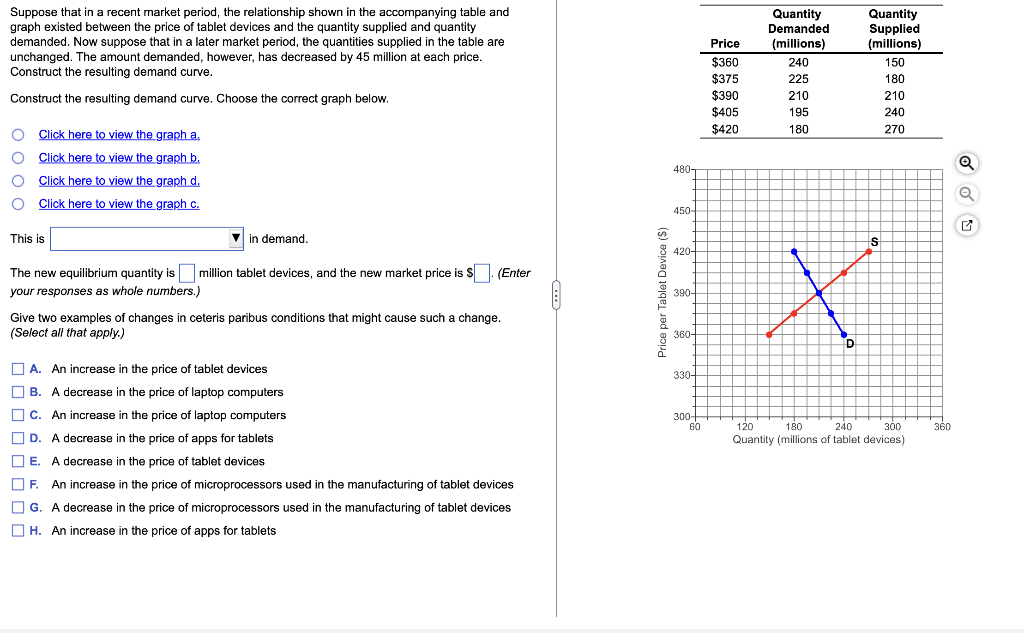
Suppose that in a recent market period, the relationship shown in the accompanying table and graph existed between the price of tablet devices and the quantity supplied and quantity demanded. Now suppose that in a later market period, the quantities supplied in the table are unchanged. The amount demanded, however, has decreased by 45 million at each price. Construct the resulting demand curve. Construct the resulting demand curve. Choose the correct graph below. This is in demand. The new equilibrium quantity is million tablet devices, and the new market price is (Enter your responses as whole numbers.) Give two examples of changes in ceteris paribus conditions that might cause such a change. (Select all that apply.) A. An increase in the price of tablet devices B. A decrease in the price of laptop computers C. An increase in the price of laptop computers D. A decrease in the price of apps for tablets E. A decrease in the price of tablet devices F. An increase in the price of microprocessors used in the manufacturing of tablet devices G. A decrease in the price of microprocessors used in the manufacturing of tablet devices H. An increase in the price of apps for tablets
Expert Answer
With decrease in demand by 45 million at each price, new demand will be New Qd195180165150135Thus new demand curve will have the following values.This
