Home /
Expert Answers /
Calculus /
shown-below-is-the-graph-of-the-flow-rate-f-t-of-a-pipe-in-gallons-per-minute-here-t-pa152
(Solved): Shown below is the graph of the flow rate \( f(t) \) of a pipe, in gallons per minute. Here, \( t= ...
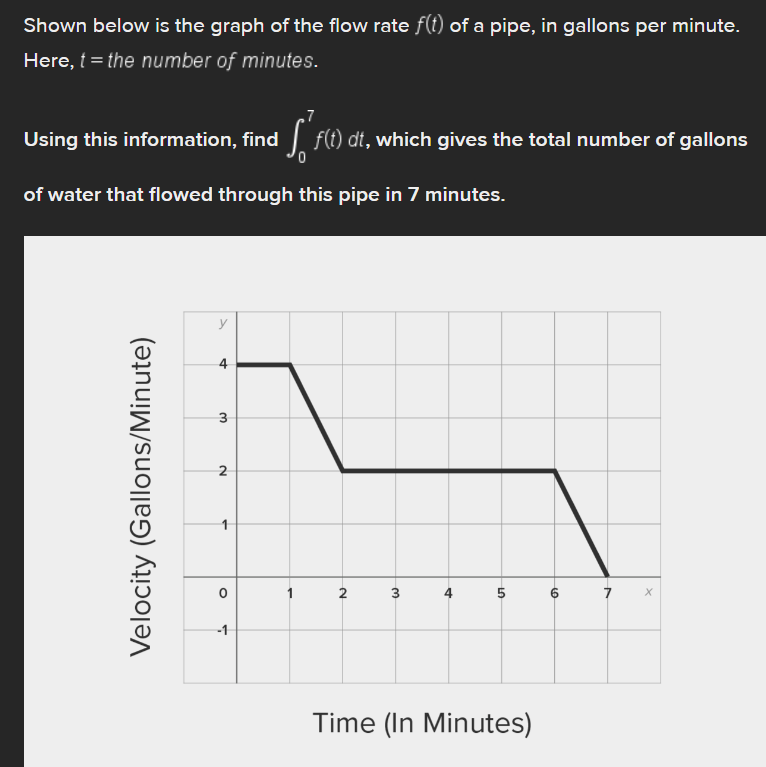
Shown below is the graph of the flow rate \( f(t) \) of a pipe, in gallons per minute. Here, \( t= \) the number of minutes. Using this information, find \( \int_{0}^{7} f(t) d t \), which gives the total number of gallons of water that flowed through this pipe in 7 minutes. Iime (In Minutes)